
Page 44 - 2021_06-Haematologica-web
P. 44
M. Novakova et al.
monocytoid cells identical to those in the original BCP-ALL clone. There was no difference in the event-free survival (EFS) between the prospective patients with or without monocytic switch (5-year EFS, 82±5.5% and 86±1.6% , respectively, Figure 4) also when only patients in the high risk/slow early response group were considered (Online Supplementary Figure S9).
Discussion
Monocytic switch provides evidence for the relationship between the monocytic and lymphoid lineages. Rigid mod- els of hematopoiesis assume early separation of the mono- cytic and lymphoid lineages, but there is increasing evi- dence of innate immune functions in lymphoid lineages, including phagocytosis.30 The biological origin of the phe- nomenon remains to be clarified. Rarely B-cell malignancies of various stages of differentiation under unknown circum- stances can undergo transdifferentiation into myeloid/histi- ocytic malignancies.31,32 An interesting area for future inves- tigation is the relationship between of monocytic cells to their CD14pos dendritic cells counterparts. CD2, a frequent aberrant marker of BCP ALL blasts prior to monocytic switching, does not clarify their fate as it is known to be expressed in subsets of both dendritic cells33 and monocytic AML.34 The constant role of the transcription factor C/EBPα seems to play a role in the process. In our previous work, we found higher expression of CEBPA in patients with monocytic switching, which was also true in this extended cohort. C/EBPα directly represses B-cell genes. DiStefano et al. reported that C/EBPα can enforce B-cell transcription factor silencing by increasing the expression of the histone
demethylase Lsd1 (Kdm1a) and the histone deacetylase Hdac1 at the protein level and that these enzymes are required for the downregulation of B-cell enhancers and the silencing of the B-cell program.35 In vitro models demon- strate that C/EBPα induces the repression of key B-cell reg- ulators such as Foxo1, Ebf1 and Pax536.
In our study we show that monocytic switch behavior is not limited to a single genotypic subset and that various leukemia genotypes show different propensities to switch to monocytic cells. In agreement with our previous report, in this study, the majority of patients whose blasts switched to monocytoids were categorized in the B-other subset (70% of patients with monocytic switch compared to 21% of patients without switch; Fisher’s exact test P<0.00001). New genomic methods – namely, RNA-seq – were recently used to discover new recurring genetic subtypes within the mixture of the genotypes thus far labeled B-other.2,3,24,25,37–40 Three of these subsets, DUX4r, PAX5-P80R, and ZNF384r, were frequently associated with switch, constituting the majority of the patients with switch in this study. We did not identify a known subtype-defining genetic aberration (B-other rest) in only 3.8% of the patients with monocytic switch (Table 1). Interestingly, all patients with PAX5-P80R presented with monocytic switch.
Although it did not reach statistical significance (probably due to the low number of patients), a switching phenome- non was observed in 24% of cases with BCR-ABL1. McClellan et al. found that primary BCR-ABL1-positive BCP-ALL cells could be reprogrammed into macrophage- like cells through exposure to cytokines in vitro or by tran- sient expression of the transcription factor C/EBPα or PU.1.41 Surprisingly, monocytic switch was not significantly more frequent in the KMT2Ar subtype than in other sub-
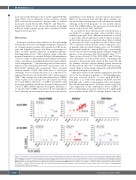
Figure 3. Correlation of the mimal reidual disease results obtained by flow cytometry and polymerase chain reaction in selected patient groups. Only samples with appropriate measured sensitivity are shown (the flow cytometry [FC] sensitivity is 0.0001 if the polymerase chain reaction [PCR]-determined minimal residual disease [MRD] <0.01; for samples with PCR-determined MRD ≥0.01, the FC measurement sensitivity is at least one log value lower than the actual PCR-determined MRD log value). In the upper part of each graph, the number of patients with MRD values FCpos/PCRneg, FCpos/PCRnq pos, and FCpos/PCRpos (upper lane); and FCneg/PCRneg, FCneg/PCRnq pos, and FCneg/PCRpos (bottom lane) are indicated. Spearman's rank correlation coefficient indicated if the P-value was <0.05. Nq pos: nonquantifiable positivepositive; BM: bone marrow.
2072
haematologica | 2021; 106(8)
