
Page 165 - 2021_06-Haematologica-web
P. 165
MYB bi-allelic targeting
ABC
DE
F
G
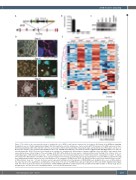
Figure 1. The outline of the experimental system for studying the role of MYB in early human hematopoietic development. (A) Scheme of the MYB gene targeting. Designations are as in Online Supplementary Figure S1B. (B) Quantitative real-time polymersase chain reaction (qRT-PCR) analysis of the MYB expression in day 6 differentiated wild-type (WT), SKO, and DKO cells. Here and elsewhere: SKO1, DKO1, and DKO2, independent single and double knockout H1-isogenic cell lines. (C) Western blot analysis of day 12 differentiated MYB knockout cells. PB-MYB+DOX, MYB-null cells transfected with a PiggyBack-TRE-CMV-MYB cDNA vector and acti- vated by doxycycline (DOX). (D) In vitro blood islands in the cytokine-free hematopoietic differentiation of human embryonic stem cells (hESC). Upper panels show representative phase-contrast images of the early stages of H1 hESC differentiation, the lower panels – immunocytofluorescent staining of the cultures at the cor- responding stages of differentiation. Scale bar – 100 mm. (E) Expression of selected transcription factors in CD43+ versus CD43– cell population on day 6, 9, and 12 of hematopoietic differentiation of H1 hESC. Gene expression levels in the heatmap are normalized by Z-score transformation across the RNA-seq experiments, with three independent biological repeats for each cell population. (F) The emergence of MYB-Venus+ DKO cells (DKO2) from the in vitro blood island structures on day 7 of differentiation. Scale bar – 100 mm. (G) Venus reporter expression faithfully reflects the dynamics of MYB mRNA levels during the time course of differentiation. The upper bar plot is the quantitation, exemplified by contour plots on the left, of the MYB-Venus expression dynamics in SKO cells (Online Supplementary Figure S3A). The lower bar plot demonstrates the quantitation of MYB mRNA by qRT-PCR in undifferentiated (UD) and differentiated WT H1 hESC on the EB stage (day 0) through day 20. The data are mean ± standard deviation, *P<0.05, two-tailed Student’s t-test.
haematologica | 2021; 106(8)
2193
