
Page 149 - 2021_06-Haematologica-web
P. 149
Antibody-mediated procoagulant platelets in VITT
strong platelet activation (median time to platelet aggre- gation 5 min, 5-5 min [range], Figure 6A). Most impor- tantly, platelet activation was completely inhibited by the mAb IV.3 that blocks the FcγRIIa and by high doses of IgG (>45 min, no aggregation, Figure 6A). No signifi- cant change was found when PF4/RBD complexes were added. Antibody-mediated platelet activation was inhib- ited when low molecular weight heparin (LMWH) was added at low concentrations by testing three sera. When sera from VITT patients were diluted, specific binding was observed to PF4 while no reaction in the buffer was found (Figure 7A).
A
Sera of vaccine-induced immune thrombotic thrombo- cytopenia patients induce PF4-dependent procoagu- lant phenotype
In order to explore the mechanism of coagulation dys- regulation in VITT, sera were incubated with washed platelets from healthy donors in the presence of buffer, heparin, mAb IV.3, IVIG, PF4, PF4+IVIG, PF4+RBD, the Spike-RBD protein or the vaccine ChAdOx1 nCoV-19. FC analyses revealed that sera from VITT patients induce remarkable changes in the distribution of CD62p/PS posi- tivity (FI CD62p/PS positive platelets [PLT]: 22.94±6.14 vs. 0.90±0.63, respectively, P=0.009, Figure 6B, Online
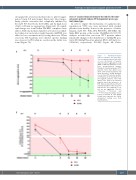
Figure 7. Antibody-mediated platelet activation and generation of procoagulant platelets with dilut- ed sera. (A) Results of heparin- induced platelet aggregation assay (HIPA) at different titrations of sera from vaccine-induced immune thrombotic thrombocytopenia (VITT) patients. Note that diluted sera (from 1:64) activated platelets only in the presence e of PF4. (B) Effect of sera from VITT patients at differ- ent titrations on the development of procoagulant platelets. Note that diluted sera (from 1:8) activated platelets only in the presence e of PF4. Data are presented as mean ± standard deviation of the measured fold increase (FI) compared to con- trol. ns: not significant; *P<0.05; **P<0.01, ***P<0.001 and ****P<0.0001. The number of sera tested is reported in each graph. Dotted lines represent the cutoffs determined testing sera from healthy donors.
B
haematologica | 2021; 106(8)
2177
