
Page 106 - 2021_06-Haematologica-web
P. 106
E. Haring et al.
A
B
CDE
F
GH
I
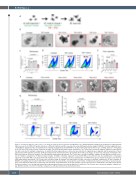
Figure 2. Treatment with bile acids reduces cell death in small intestinal organoids and MODE-K cells. (A) Experimental setting for the treatment of organoids with tumor necrosis factor (TNF) (20 ng/mL), interferon γ (IFNγ) (2.5 ng/mL) and the respective bile acids. (B) Representative images of BALB/c intestinal organoids treat- ed with TNF as described in (A). (C) Quantification of damaged organoids treated with TNF as in (A) performed by manual microscope counting. Data were normalized to the TNF plus (TNF+)vehicle group. Statistical analysis of n=4 biologically independent experiments. The P-value was calculated using an ordinary one-way ANOVA test with correction for multiple comparisons. (D and E) Intestinal organoids were cultured as described in (A). Organoids were digested and the proportion of dead cells was determined by flow cytometry. (D) Representative flow cytometry dot plots. (E) Quantification of the percentages of dead cells. Data were normalized to the TNF+vehicle group. Statistical analysis of n=3 biologically independent experiments. The P-value was calculated using the ordinary one-way ANOVA test with correc- tion for multiple comparisons. (F) Representative images of BALB/c intestinal organoids treated with IFNγ as described in (A). (G) Quantification of damaged organoids treated with IFNγ as in (A) performed by manual microscope counting. Data were normalized to the IFNγ+vehicle group. Statistical analysis of n=3 biolog- ically independent experiments. The P-value was calculated using an ordinary one-way ANOVA test with correction for multiple comparisons. (H and I) Analysis of MODE-K cell viability after treatment with TNF ± chenodeoxycholic acid (CDCA), ursodeoxycholic acid (UDCA), 6-ethylchenodeoxycholic acid (OCA) or tauroursodeoxy- cholic acid (TUDCA) for 48 hours performed by flow cytometry. (H) Quantification of the percentages of dead cells. Data were normalized to the TNF+vehicle group. Statistical analysis of n=3 biologically independent experiments performed in technical duplicates or triplicates. The P-values were calculated using the ordinary one- way ANOVA test with correction for multiple comparisons. (I) Representative flow cytometry dot plots.
2134
haematologica | 2021; 106(8)
