
Page 48 - 2021_07-Haematologica-web
P. 48
J. Hu et al.
Results
WEE1 is highly expressed in T-cell acute lymphoblastic leukemia
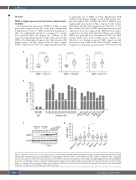
To determine the expression of WEE1 in T-ALL, we ana- lyzed gene expression profiles from three independent T-ALL patient cohorts.28-30 WEE1 expression in primary T- ALL was significantly elevated as compared to normal bone marrow (BM) cells (Figure 1A). Analysis of the Cancer Cell Line Encyclopedia (CCLE)31 demonstrated that WEE1 is the third highest expressed in T-ALL among 1,429 human cancer cell lines derived from 40 tumor origins (Online Supplementary Figure S1), suggesting the particular-
ly important role of WEE1 in T-ALL. Quantitative PCR analysis verified these findings in ten T-ALL patient sam- ples and eight T-ALL cell lines that WEE1 mRNAs were significantly increased in T-ALL compared with normal BM (Figure 1B and Online Supplementary Table S3). To fur- ther correlate the level of WEE1 transcript with its protein expression, we next compared the WEE1 protein expres- sion between normal and transformed thymocytes. Again, WEE1 was generally more abundant in T-ALL cells than normal thymocytes from healthy donors (Figure 1C). Related to our finding, increased WEE1 expression had previously been found in 58 adult T/B-ALL samples as compared to normal mononuclear cells.13 We next assessed
A
B
CD
Figure 1. High WEE1 expression in T-cell acute lymphoblastic leukemia (T-ALL). (A) WEE1 mRNA expression was analyzed in primary T-ALL and normal bone marrow (BM) from microarray datasets (left, 6 normal BM and 11 T-ALL samples in GSE7186; middle, 4 normal BM and 46 T-ALL samples in GSE28497; right, 7 normal BM
and 117 T-ALL samples in GSE26713). The distributions of WEE1 mRNA expression are presented as Log
median-entered intensity and shown in Box-and-Whisker plots with the median value (line), the interquartile range (box), and up to 1.5x the interquartile range (bars). (B) Relative WEE1 mRNA expression in normal BM, pri- mary T-ALL cells and T-ALL cell lines as indicated. (C) Immunoblots of WEE1 in normal human thymus, primary T-ALL cells and T-ALL cell lines as indicated. ACTIN serves as a loading control. (D) Analysis of WEE1 expression in 264 primary T-ALL samples that are categorized into eight different subtypes. y-axis denotes WEE1
FPKM values in Log
2
scale from the RNA-sequencing (Seq) dataset.
2
1818
haematologica | 2021; 106(7)
