
Page 213 - 2021_07-Haematologica-web
P. 213
Fetal hemoglobin induction with a DNMT1 inhibitor
representing 25x the concentrations that increased HbF 2- fold, GSK3482364 and decitabine caused, respectively, 58% and 90% cell growth inhibition of EPC over 5 days of cell culture.
In order to better characterize the relative acute cytotox- icity of GSK3482364 and decitabine, caspase 3/7 activity was measured in EPC treated with compounds for 2 days. GSK3482364 and decitabine increased cleavage of a cas- pase 3/7 substrate by 1.5-fold and 16.5-fold, respectively (Figure 2C) at the highest test concentration of 10 mM. Comparing at equivalent relative potencies 18-fold above the concentration that causes 2-fold HbF induction, GSK3482364 (10 mM) and decitabine (0.7 mM) increased caspase activity by 50% and 120%, respectively. In agree- ment with the cell growth assays, these data indicate potentially differentiated cytotoxicity between the two compounds.
It has previously been observed that treatment with cyti- dine analog HMA including 5-aza, decitabine, and zebular- ine cause destabilization of DNMT1 and to a lesser extent DNMT3A and DNMT3B, through a ubiquitin-dependent mechanism.32-36 There is a debate whether the effects of the cytidine analog HMA on DNMT3A and DNMT3B protein levels are due to direct inhibition and DNA adduct forma- tion, or are instead an indirect outcome of DNMT1 inhibi- tion. However, evidence that zebularine-incorporated oligonucleotides can trap and biochemically inhibit DNMT1, DNMT3A, and DNMT3B37, 38 suggests that cyti- dine analog HMA may not be DNMT1-selective. In our study of EPC treated for 24 hours with decitabine, both DNMT1 and to a lesser extent DNMT3A levels were shown to decrease while DNMT3B was largely unaffected (Online Supplementary Figure S2). Treatment with GSK3482364 also caused a decrease in DNMT1 protein, although less than decitabine, and had no effect on either DNMT3A or DNMT3B levels. The mechanism by which GSK3482364 causes DNMT1 protein levels to decrease remains a matter of investigation.
In order to characterize longer treatment effects of GSK3482364 on cellular expansion and differentiation, bone marrow CD34+ cells were expanded and differentiat- ed in a three-phase erythroid cell differentiation protocol39 over 18 days in the presence of GSK3482364, decitabine, or vehicle. Fresh compound or vehicle were added at each stage of media exchange. On day 18, cells were stained with Syto16 to label nucleic acids and to distinguish mature enucleated reticulocytes from less mature erythroblasts. Cells were also stained with an anti-HbF antibody and ana- lyzed by flow cytometry. On day 18, it was found that 31% of the vehicle-treated cells had matured into enucleat- ed reticulocytes (Syto16low), distinguishable from the less mature erythroblasts (Syto16high). Consistent with HbF
ELISA results, GSK3482364 treatment (1.0 mM) for 18 days caused a >4-fold increase in HbF-positive cells compared to vehicle (Figure 3). Moreover, the resulting fraction of cells maturing into reticulocytes was comparable to or slightly higher than vehicle treatment, indicating that treated cells were not arrested earlier in erythropoiesis. Decitabine (0.1 mM) treatment caused a similar increase in HbF-positive cells as GSK3482364 (1 mM) when compared to vehicle, but also caused a marked decrease in the proportion of cells maturing into reticulocytes, reflecting delayed or arrested cellular maturation at this concentration.
In order to measure the in vivo HbF induction activity of GSK3482364, the Townes mouse model of SCD40 was employed in which mouse a- and β-globin genes were replaced with human genes HBA1, HBG1, and HBB includ- ing the E6V sickle mutation. Mice in this model express HbF during fetal development, repress HbF shortly after birth, and experience cell sickling and multiple organ pathologies analogous to sickle cell disease. GSK3482364 was administered orally (p.o.) to 6-8 week old mice b.i.d. at 10 or 50 mg/kg for 12 days (weekday dosing only). At the end of dosing, HbF levels were measured in whole blood by an HPLC method, and F-cells were measured by flow cytometry. Compared with vehicle treated animals, both dose levels of GSK3482364 caused significant increases in both HbF and F-cells (Figure 4). At the 50 mg/kg dose, HbF increased 10.3-fold and F-cells increased 8.4-fold relative to vehicle treatment.
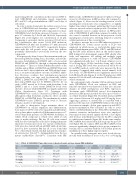
In a subsequent study of murine SCD model mice treated with GSK3482364, blood was analyzed for HbF, and femoral bone marrow was harvested on day 12 to measure changes in DNA methylation and RNA expression. Treatment with GSK3482364 caused dose-dependent increases in HbF protein in whole blood by up to 9-fold ver- sus vehicle treatment (Figure 5A). No further increase in HbF was observed between 33.3 mg/kg and 100 mg/kg doses, suggesting a plateau of activity that is consistent with a plateau of the exposure of GSK3482364 (data not shown). In bone marrow samples, globin gene expression and HBG1 promoter methylation were evaluated. In order to assess effects on DNA methylation, the -53 bp HBG1 methylation- sensitive restriction endonuclease assay was employed. Bone marrow from treated animals showed a dose-depen- dent decrease in methylation at this site by 25% compared to vehicle-treated animals (Figure 5A). In the same samples, HBG1 mRNA levels increased in all dose groups by up to 29- fold (Figure 5B). In contrast, HBB and HBA1 mRNA levels were not significantly changed in dose groups compared to baseline; this is consistent with the low baseline promoter methylation of these highly expressed genes.
In a parallel study, transgenic mice were dosed subcuta- neously with decitabine at doses of 0.2, 0.4, or 0.8 mg/kg
Table 1. Effects of GSK3482364 twice daily in vivo on blood cell counts and bone marrow DNA methylation.
Platelets Neutrophils
(x103/μl) (x103/μl)
819±145 3.7±2.1
3.7mg/kg 7.4±0.3
11.1mg/kg 8.1±1.0
33.3mg/kg 7.0±1.0 733±90 3.2±2.3 9.7±1.8 0.4±0.2 -25.4±8.1** 100mg/kg 7.6±1.4 678±210 2.3±1.2 11.0±4.9 0.3±0.3 -23.9±9.5**
Study 1- RBC GSK3482364 (x106/μl)
Vehicle 7.7±1.0
Lymphocytes
(x103/μl)
14.9±3.9
Monocytes % Change DNA
(x103/μl) Methylation
0.7±0.5 0±4.0
757±150 2.9±2.4 854±107 2.4±0.8
12.6±5.6 10.7±3.3
0.5±0.2 -2.2±2.7 0.5±0.4 -14.7±5.7**
Mean +/- standard deviation are shown.Asterisks indicate significance by 1-way ANOVA.(**P<0.001)
haematologica | 2021; 106(7)
1983
