
Page 211 - 2021_07-Haematologica-web
P. 211
Fetal hemoglobin induction with a DNMT1 inhibitor
approximately sex balanced groups of five to six mice. Unless oth- erwise noted, mice were administered vehicle (10% DMA/90% PEG400) or GSK3482364 twice daily (b.i.d.) by oral gavage on weekdays with no doses on the intervening 2-day weekend, typ- ically for a 12 days study. Alternatively, mice were administered vehicle (phospahate buffered saline [PBS]) or decitabine thrice weekly (Monday, Wednesday, Friday) subcutaneously (s.c.) for a total of six doses. At the end of the dosing period, blood was col- lected into EDTA tubes for analysis, and HbF was analyzed as detailed below. For bone marrow analysis, femurs from mice were flushed with Dulbecco’s PBS, cells were centrifuged briefly to pel- let, and cell pellets were processed for DNA methylation analysis (as above) or for RNA analysis (detailed in the Online Supplemental Appendix). For bone marrow histology assessment, sternums from treated animals were formalin-fixed, paraffin embedded, sec- tioned and stained with hematoxylin and eosin. Complete blood counts were conducted with an Advia Hematology Analyzer (Siemens).
Fetal hemoglobin analysis by high-performance liquid chromatography or flow cytometry
Percentage HbF was determined by high-performance liquid chromatography (HPLC) using the D-10 Hemoglobin Analyzer (Bio-Rad). Percentage F-cells was determined by flow cytometry with a FACSCanto I (BD BioSciences) using a mouse monoclonal anti-human HbF antibody conjugated to allophycocyanin (APC) (Life Technologies). For analysis of human cell cultures, the nuclear stain Syto16 (Life Technologies) was used to distinguish EPC (Syto16high) from enucleated reticulocytes (Syto16low). For analysis of mouse whole blood samples, Syto16 was used to distinguish mature red blood cells (Syto16negative) from reticulocytes (Syto16low). Flow cytometry data were analyzed with FlowJo v7 software (Tree Star). One-way ANOVA of data was employed to determine significance of changes relative to vehicle treated sam- ples (Graphpad Prism v7).
Results
A high-throughput screen was conducted to identify novel biochemical inhibitors of DNMT1 methyltransferase
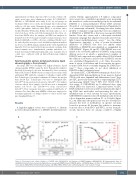
Figure 1. Biochemical and cellular inhibition of DNMT1 with GSK3482364. (A) Structure of DNMT1 inhibitor GSK3482364. (B) Representative data for GSK3482364 activity in biochemical methyltransferase assays with DNMT1 (black), DNMT3A (white), or DNMT3B (gray). (C) Effect of GSK3482364 on 5-methylcy- tosine (black), HBG1/HBG2 -53bp methylation (gray), and HBG1/HBG2 mRNA (red) in erythroid progenitor cells treated for 5 days.
activity. Briefly, approximately 1.8 million compounds were assayed in a scintillation proximity assay measuring the transfer of a radioactive methyl group by recombinant DNMT1 to a hemi-methylated 40-mer DNA substrate (Stowell, A. et al. manuscript in preparation; Pappalardi, M. et al. manuscript submitted). Screening hits were further profiled to eliminate compounds that were also inhibitors of DNMT3A or DNMT3B or that were non-specific DNA binders. From this screen and a subsequent medicinal chemistry campaign that employed non-radioactive break- light format methyltransferase assays 27 (see the Online Supplementary Appendix), a class of potent biochemical inhibitors of DNMT1 that does not inhibit either DNMT3A or DNMT3B was identified, as exemplified by GSK348236428 (Figure 1A and B). GSK3482364 was con- firmed to be a reversible inhibitor of DNMT1 using a jump dilution protocol in which a preincubated complex of DNMT1 and compound was rapidly diluted 100-fold with the addition of substrates, and recovery of DNMT1 activity was established (Pappalardi, M. et al.). Since the mecha- nism of action of decitabine and 5-aza requires incorpora- tion into DNA before covalently trapping the DNMT pro- teins,29,30 these compounds do not show inhibition of DNMT1 in this biochemical assay.
In cultured EPC, GSK3482364 treatment produced dose- dependent DNA hypomethylation. Bone marrow derived CD34+ cells were expanded and differentiated over 7 days into EPC, previously characterized as expressing high CD71 and increasing CD235.23 Day 7 EPC were treated with a dose range of GSK3482364 for 5 additional days, after which DNA was harvested. Compound effects on EPC DNA methylation were measured by enzymatically digest- ing DNA into nucleosides and measuring the ratio of methylcytosine to total cytosine by mass spectrometry. GSK3482364 treatment reduced 5-methylcytosine levels in
of 0.24 mM (Figure 1C). An additional orthogonal assay was also developed to measure the level of methylation on specific cytosines located at positions -53 basepair (bp) relative to transcrip- tion start sites of both HBG1 and HBG2. As has been pre- viously reported, these are among a number of highly
a dose-dependent manner with an IC 50
ABC
haematologica | 2021; 106(7)
1981
