
Page 108 - 2021_07-Haematologica-web
P. 108
L. Janssen et al.
(mean QoL 6.1 ± 1.3 and 7.8 ± 1.1, respectively; P<0.001). Table 1 shows the univariable and multivariable logistic regression analyses of the predictors of severe fatigue in CML patients. The final multivariable model included: age (OR 0.96, 95% CI: 0.93-0.99; P=0.004), female gender (OR 1.76, 95% CI: 0.92-3.34; P=0.09), CCI (OR 1.91, 95% CI: 1.16-3.13); P=0.011), the use of comedication known to cause fatigue (OR 3.43, 95% CI: 1.58-7.44; P=0.002), and physical activity at different intensities compared to phys- ical inactivity, including moderately active (OR 0.43, 95% CI: 0.12-1.52; P=0.19), vigorously active (OR 0.22, 95% CI:
0.06-0.74; P=0.014), and very vigorously P<0.001). The area under the curve of the final model was 0.79 (95% CI: 0.73-0.85) and the calibration slope was 1.01. The predict- ed severe fatigue and associated observed fatigue are dis- played in Figure 2, showing a positive predictive value of 73%, a negative predictive value of 68%, a sensitivity of 76%, and a specificity of 65%. Our model can be described by the following equation: log-odds = 1.98 – 0.04 * age + 0.56 * gender (male=0, female=1) + 0.65 * CCI + 1.23 * use of comedication known to cause fatigue (no=0, yes=1) – physical activity level (inactivity=0, moderately
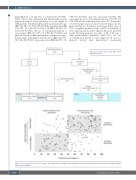
Figure 1. Flowchart of the study. CML: chronic myeloid leukemia.
Figure 2. Predicted and observed severe fatigue. The predicted severe fatigue of the multivariable model is plotted against the observed severe fatigue. Each dot represents an individual.
1878
haematologica | 2021; 106(7)
