
Page 71 - 2021_06-Haematologica-web
P. 71
RUNX1-EVI1 blocks RUNX1 and EVI1 driven cell fate
A
B
C
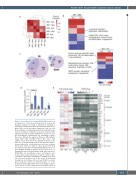
Figure 3. Gene expression following RUNX1-EVI1 induction is de-regulated in a developmental-stage-specific manner. (A) Heatmap showing the results of hierarchical clustering of hemogenic endothelium 1 (HE1), HE2 and hematopoietic pro- genitor (HP) cells in both minus doxycycline (-dox) and +dox treated samples. Clustering was performed using sample-wise Pearson correlation coefficients for all genes expressed with fragments per kilobase million (FPKM) >1 in at least one sam- ple. (B) Heatmaps comparing the log2 fold-change of genes that were differentially expressed between differentiation stages (HE1 to HE2, and HE2 to HP) in either -dox or +dox samples. Genes were placed into eight groups based on the difference of the fold-change between -dox and +dox samples, and are indicated as a colored bar to the left of the heatmap. Selected GO terms are shown for those groups that show developmental disruption following RUNX1-EVI1 induction. (C) Venn diagram showing the number of genes that are up- or downregulated in each differentiation stage after induction of RUNX1-EVI1. (D) Quantitative reverse transcriptase poly- merase chain reaction expression of Cdkn1c, relative to glyc- eraldehyde 3-phosphate dehydrogenase (Gapdh), n=3, error bars represent standard error of the mean. (E) Heatmaps showing log2 fold change (left) and log2 FPKM for selected genes involved in various mesodermal lineages, +/- on the heatmap indicates those which show a fold change in expres- sion of at least 1.5. EMT: epithelial-to-mesenchymal transition.
E
haematologica | 2021; 106(6)
1573
D
