
Page 63 - 2021_06-Haematologica-web
P. 63
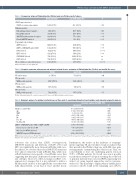
Ph-like ALL correlates with MRD+ and outcome
Table 3. Comparison between Philadelphia-like (Ph-like) and non-Ph-like genetic features.
CRLF2 expression level
CRLF2 overexpressing samples
Mutational status
RAS pathway mutated samples Clonal RAS mutated
JAK/STAT pathway mutated samples Clonal JAK/STAT mutated
Copy number aberrations
IKZF1 deleted
IKZF1+ CDKN2A/2B and/or PAX5 BTG1 deleted
EBF1 deleted
CDKN2A/2B deleted
PAX5 deleted
TK or cytokine receptor fusion genes
TK: tyrosine kinase; ns: not significant.
BCR/ABL1-like 10/28 (35.7%)
6/24 (25%) 1/24 (4.16%) 8/24 (33.3%) 8/24 (33.3%)
14/22 (63.6%) 10/22 (45.5%) 11/22 (50%) 6/22 (27.3%) 7/22 (31.8%) 7/22 (31.8%) 10/23 (43.5%)
non-BCR/ABL1-like 8/60 (13.3%)
26/50 (52%) 23/50 (46%) 7/50 (14%) 2/50 (4%)
12/48 (25%) 7/48 (14.6%) 4/48 (8.3%) 1/48 (2.1%) 23/48 (47.9%) 11/48 (22.9%) 1/37 (2.7%)
P
0.018
0.025 0.001 0.04 0.001
0.002
0.007 <0.001 0.003 ns ns <0.001
Table 4. Complete remission achievement and minimal residual disease evaluation in Philadelphia-like (Ph-like) and non-Ph-like cases.
CR achievement
TP1 (week 4)
MRD-positive patients TP2 (week 10)
MRD-positive patients
TP3 (week 16)
MRD-positive patients
Ph-like
20 (74.1%)
14/18 (77.8%)
9/17 (52.9%)
5/12 (41.7%)
non-Ph-like
54 (91.5%)
19/46 (41.3%)
9/45 (20%)
5/37 (13.5%)
P
0.044
0.012 0.025 0.05
Ph-like: Philadelphia-like; CR: complete remission; TP: time point; MRD: minimal residual disease.
Table 5. Univariate analyses for minimal residual disease at time point 2, considering clinically relevant variables and molecular prognostic markers. Univariate analysis for MRD_TP2
Ph-like vs. non-Ph-like Age
WBC
Plts
Hb
F vs. M
No SR vs.SR
IKZF1+ CDKN2A/2B and/or PAX5 vs IKZF1-only/WT Cell cycle genes deletion vs WT
RAS clonal vs WT/M subclonal
JAK/STAT clonal vs WT/M subclonal
OR (95%CI)
4.5 (1.373-15.508) 1.012 (0.98-1.045) 1.013 (1-1.033) 0.987 (0.974-0.998) 0.832 (0.638-1.06) 0.459 (0.145-1.315) 0.304 (0.065-1.048)
1.869 (0.49-6.674)
0.88 (0.279-2.773)
0.8 (0.239-2.51)
2.596 (0.463-13.293)
P
0.014 0.475 0.133 0.0365 0.152 0.1602 0.083
0.339
0.8253
0.706
0.2482
MRD: minimal residual disease; Ph-like: Philadelphia-like;WBC: white blood cell; Plt: platelet; Hb: hemoglobin; F: female; M: male; SR: standard risk;WT: wild-type;WT/M: wild-type/ mutated; OR: odds ratio; CI: Confidence Interval.
roborates the notion that CRLF2 overexpression, JAK/STAT mutations and deletions of IKZF1, BTG1 and EBF1 are significantly more frequent in Ph-like ALL cases. In addition, we observed that clonal JAK/STAT mutations were almost exclusively found in Ph-like ALL, while clon- al RAS mutations were specific of non-Ph-like cases, thus suggesting that they play a different role in the two molec- ular subtypes. Moreover, when focusing on CRLF2 over- expression, it emerges that it is not sufficient to induce a Ph-like profile: indeed, of the eight Ph-like cases that were fully characterized, seven had at least another lesion.
Furthermore, the results on the incidence of rearrange- ments targeting TK and cytokine receptors indicate that they prevail in the Ph-like subgroup, with ABL-class gene rearrangements outnumbering the other lesions. Thus, we could identify at least one underlying genetic lesion in 70.8% of Ph-like patients. Not for all cases was it possible to perform an extensive biological screening due to the lack of genomic material (four cases) and RNA-sequencing was carried out using targeted approaches and not genome- wide tools. This may help to explain why no further genet- ic lesions could be found in the remaining cases (29.2%)
haematologica | 2021; 106(6)
1565
