
Page 61 - 2021_06-Haematologica-web
P. 61
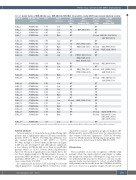
Ph-like ALL correlates with MRD+ and outcome
Table 2A. Genetic features of BCR/ABL1-like cases. BCR/ABL1-like BCR/ABL1 -like prediction, scoring, CRLF2 expression and mutational screening.
BCR/ABL1-like prediction
BCR/ABL1-like BCR/ABL1-like BCR/ABL1-like BCR/ABL1-like
BCR/ABL1-like BCR/ABL1-like BCR/ABL1-like BCR/ABL1-like BCR/ABL1-like BCR/ABL1-like
BCR/ABL1-like BCR/ABL1-like BCR/ABL1-like
BCR/ABL1-like BCR/ABL1-like
BCR/ABL1-like BCR/ABL1-like BCR/ABL1-like BCR/ABL1-like BCR/ABL1-like BCR/ABL1-like BCR/ABL1-like BCR/ABL1-like BCR/ABL1-like BCR/ABL1-like BCR/ABL1-like BCR/ABL1-like
CRLF2 RAS expression pathway
status
Low WT
Low M Low WT High WT
Low WT Low M High M High WT Low WT Low M
High WT Low WT Low M
High WT Low WT
Low WT Low WT Low WT Low NA High NA Low WT Low M clonal Low NA High WT High NA High WT High WT
Record ID
B-ALL_1
B-ALL_3 B-ALL_4 B-ALL_7
B-ALL_16 B-ALL_22 B-ALL_26 B-ALL_31 B-ALL_32 B-ALL_34
B-ALL_36 B-ALL_37 B-ALL_41
B-ALL_44 B-ALL_45
B-ALL_46 B-ALL_52 B-ALL_55 B-ALL_61 B-ALL_62 B-ALL_64 B-ALL_73 B-ALL_76 B-ALL_81 B-ALL_92 B-ALL_96 B-ALL_97
Survival analyses
Survival analyses at 24 months showed that Ph-like ALL patients had a significantly inferior EFS than non-Ph-like patients (33.5% vs. 66.2%, P=0.005); this difference was also evident with regard to DFS (45.5% vs. 72.3%, P=0.062), though to a lesser extent, as illustrated in Figure 2; OS was also investigated, and although not significant, it was inferior in Ph-like ALL cases than in non-Ph-like patients (48.5% vs. 72.9%, P=0.16, Online Supplementary Figure S3). The lack of significance is most likely due to the fact that a higher number of Ph-like patients, because of persistent MRD positivity, underwent, as per protocol guidelines, HSCT (40% vs. 11% in Ph-like vs. non-Ph-like cases, respectively, P=0.015).
In a multivariate model for EFS, adjusting for relevant clinical parameters - including HSCT, evaluated as a time
Score
3.073
0.928 0.347 1.216
0.788 0.157 3.128 2.382 5.720 0.725
0.205 0.386 0.726
1.587 0.262
2.449 1.013 0.544 2.722 0.335 -0.043 0.048 1.971 1.150 -0.112 6.371 3.432
RAS
pathway mutations (VAF)
FLT3_ITD (5.4%)
FLT3_V491L (11.2%) NRAS_G13D (4.1%)
PTPN11_Y279 S (1.9%); NRAS_G12D (2.6%); KRAS_G12GG (5.2%)
KRAS_G12A (4.4%); PTPN11 V194L (4.5%)
JAK/STAT
pathway status
WT
WT
WT
JAK/STAT
pathway mutations (VAF)
Mclonal JAK1DI630-631V(44.5%), JAK1 V658I (35.5%)
WT
WT M clonal M clonal WT WT
M clonal WT M clonal
WT M clonal
WT WT WT NA NA WT WT NA WT NA
M clonal M clonal
JAK1_V658I (35.5%) CRLF2_F232C (46.8%)
JAK2_R683G (43.9%) IL7R_INDEL (38.4%);
JAK2_C618F (3.3%) JAK3_T21M (19.1%);
JAK1_T688I (5.7%)
KRAS_G12D (35.9%)
CRLF2_V136M (60%)
JAK2_R683G (10.2%); IL7R_S185C (18.1%); JAK1_V658F (13.8%)
BCR/ABL1-like
ALL:acute lymphoblastic leukemia;VAF:variant allele frequency,FISH:fluorescence in situ hybridization;RNA seq:RNA sequencing;WT:wild-type;NA:not analzyed.
B-ALL_100
-0.180
WT
dependent covariate - and genetic prognostic markers, the Ph-like profile, age and Hb levels were the only risk factors that retained statistical significance (Table 6). Notably, however, Ph-like patients undergoing an allogeneic trans- plant showed a trend towards better EFS (P=0.078).
Discussion
The possibility of an early recognition of Ph-like ALL patients offers the unprecedented opportunity to refine the prognostic categories of Ph-negative ALL, and to bet- ter understand the reasons for the poor outcome. In the present study, we investigated a cohort of adult B-NEG ALL patients enrolled in the front-line GIMEMA LAL1913 protocol,20 based on a pediatric-inspired backbone and in
Low WT
haematologica | 2021; 106(6)
1563
