
Page 273 - 2021_06-Haematologica-web
P. 273
Letters to the Editor
to the response group indicating that MK2 may lead to drug-resistance in MM (Figure 1C). The distinction of MM patients with MK2 was clinically relevant and patients with high-MK2 expression had poor outcomes in the APEX cohorts (Figure 1D). Since the APEX cohort was comprised with relapsed MM patients, we also examined the patients who eventually relapsed in TT2 cohort. The results demonstrated that MM patients with higher MK2 expression were associated with poor sur- vival, event free survival and overall survival (Figure 1E and F). These findings from two independent cohorts suggest that increased MK2 expression may lead to MM drug-resistance and relapse. Herein we propose that MK2 is a poor prognostic marker or a high-risk gene in MM.
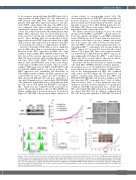
In order to determine if MK2 plays a role as a high-risk gene in MM rather than a sequential phenomenon, we knocked down MK2 expression in MM cells using lentiviral single hairpin RNA (shRNA) transfection. We first detected the protein expression levels of MK2 in MM cells by western blot and found that all the nine MM cell lines, XG1, CAG, ARP1, U266, OMP2, H929, MM.1S, 8226 and OCI-MY5, used in this assay ubiqui- tously expressed MK2 (data not shown). Then we down- regulated MK2 expression in ARP1 and OCI-MY5 cells by lentiviral shRNA particles. As shown in Figure 2A, MK2 expression was remarkably knocked-down in MK2-shRNA transfected MM cells (KD) compared to the control (Ctrl). In order to expose the effect of MK2 on MM cell growth, KD and Ctrl cells were cultured for 5 days and cell numbers were counted daily. MK2-KD MM cells exhibited a significantly lower cell growth rate than the Ctrl cells in both ARP1 and OCI-MY5 cells (Figure 2B), which was also verified by MTT assay (data not shown). The growth inhibition effect of MK2-shRNA was further confirmed by a clonogenecity assay. As shown in Figure 2C, MK2-KD cells generated ample reduction of
colonies relative to corresponding control cells. The decreased growth rate of MK2-KD cells was ascribed to increased apoptotic cell death by MK2 inhibition, and flow cytometry showed that Annexin V positive cells sig- nificantly increased after MK2-shRNA transfection for 48h (Figure 2D). These results suggest MK2 expression is important for MM cell growth in vitro.
We further extended our findings to an in vivo study and injected both ARP1KD and ARP1Ctrl cells subcutaneous- ly into the opposite side flanks of each NOD scid gamma mouse (NSG) mouse (n=4). Tumor diameters were meas- ured and recorded twice a week to examine the growth rate of the tumor cells. After 4 weeks, the tumors pro- duced by ARP1KD cells were visibly smaller than their cor- responding ARP1Ctrl counterparts. The average weight of ARP1KD tumors (0.39 g) was 25% lower than the control tumors (1.55 g; Figure 2E). Time course regression analy- ses of growth rates exhibited that the ARP1KD tumors vol- ume significantly fell behind the ARP1Ctrl control tumors (Figure 2F). These results indicate that genetic knock- down of MK2 retards myeloma growth in vivo.
Inversely to the knockdown assay, we transfected MM cells with MK2 CRISPR lentiviral activation particles,15 and verified success of the transfection by western blot assay which showed a visible elevation of MK2 expres- sion in the lentiviral-transfected (OE) cells compared with control cells (WT) (Figure 3A). The trypan blue cell number counting assay demonstrated that ARP1 and OCI-MY5 MK2-OE MM cells presented a higher growth rate than their WT counterpart after 5 days of culture (data not shown). Next, a colony formation assay was employed and indicated that regardless of experimental conditions, MK2-OE cells generated more colonies than WT cells. Initially, MK2-OE cells formed a higher number of colonies than WT cells. In addition, compared with WT cells, the growth capability of MK2-OE cells treated
ABC
DEF
Figure 2. Decreased MK2 expression induces multiple myeloma cellular apoptosis and growth inhibition in vitro and in vivo. (A) MK2 expression in ARP1 and OCI-MY5 cells was measured by western blot after MK2-single hairpin RNA (shRNA) transfection. (B) Cell growth curve was drawn by trypan blue staining after observing ARP1 and OCI-MY5 MK2-knockdown (KD) and control (Ctrl) cells for 5 days. (C) Clonogenicity evaluation for the Ctrl and MK2-KD ARP1 and OCI-MY5 cells. (D) Flow cytometry for cellular apoptosis marker Annexin V in MM cells after MK2-shRNA lentivirus transfection for 48 hours. (E) Mean weight tumors derived from ARP1-Ctrl and ARP1-KD cells on day 30 post injection. (F) Tumor growth time course in NOD/SCID mice xenografted by ARP1-Ctrl and ARP1-KD cells in each flank respectively (n=4).
