
Page 269 - 2021_06-Haematologica-web
P. 269
Letters to the Editor
AB
CD
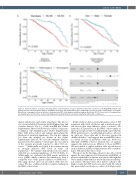
Figure 1. Survival analysis of factors affecting silent cerebral infarcts events in patients with sickle cell disease. (A) Kaplan-Meier plot com- paring outcomes in hemoglobin (Hb) SS and HbSC genotypes. (B) Kaplan-Meier plot comparing outcomes in males and females. (C) Kaplan- Meier plots comparing outcomes with no α thalassaemia (AT), heterozygous and homozygous deletional AT. (D) Forest plot of Cox-proportion- ate hazard ratios for the three factors affecting silent cerebral infarcts outcomes in patients with sickle cell disease.
ulation substructure and cryptic relatedness. The discov- ery cohort included 403 patients with full phenotype and covariate datasets. The lGC (0.986) and QQ plot (Online Supplementary Figure S1A) showed no evidence of genom- ic inflation. The Manhattan plot (Online Supplementary Figure S1B) did not show any variants approaching the threshold of statistical significance. The top five variant loci from the analysis are shown in the Online Supplementary Table S1. We used the summary statistics generated by this analysis to interrogate the association of five variants previously reported to affect SCI out- comes.11-13 Additionally, we looked at the variants known to strongly influence HbF levels in sickle cell populations.14 No variants demonstrated an association with SCI at a nominal significance of P<0.05 (Table 1). Additionally, we evaluated the HbF genetic prediction score, g(HbF), which combines four markers to form a composite score of the genetic influence on HbF levels.10 This again did not show an association with SCI out- comes. We also confirmed all these negative findings in the HbSS cohort alone.
In this study, we have reviewed prevalence rates of SCI in patients with sickle cell disease and considered genetic risk factors that may influence their occurrence. We found the SCI prevalence in the HbSS cohort similar to that reported previously,1 but additionally, report that the HbSC patients have a notably high prevalence, albeit at an older age. These data add to the rates reported in childhood studies7,8 and suggests that as with HbSS, there is a linear increase in prevalence with age. Moreover, although our HbSC cohort is small in size, our analysis suggests the risk factors are different to those in HbSS. We were unable to explore whether older age risk factors such as diabetes mellitus or hypertension were contribut- ing to SCI risk in this older cohort.
We report, for the first time, the protective effect of AT against the development of SCI in patients with HbSS. A previous study failed to find an association, although this was a smaller study with less well defined neuroradiolog- ical criteria.15 This protective effect may be related to the higher steady state Hb levels associated with AT, which has previously been shown to confer a 2-fold protective
haematologica | 2021; 106(6)
1771
