
Page 268 - 2021_06-Haematologica-web
P. 268
Letters to the Editor
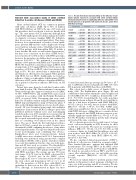
Table 1. Results from linear mixed modelling on the influence of can- didate variants reported to associate with silent cerebral infarcts (SCI) and variants known to significantly influence clinical HbF levels on SCI outcomes in all patients with sickle cell disease, and in those with HbSS genotype.
Genome wide association study of silent cerebral
infarction in sickle cell disease (HbSS and HbSC)
Silent cerebral infarcts (SCI) are common in patients
with sickle cell disease (SCD). Up to 35% of children
with HbSS will have an SCI by the age of 15 years, and
this prevalence has been shown to increase linearly with
age.1 The exact nature of SCI is unknown, although they
are probably small regions of ischemic damage detectable
on magnetic resonance imaging (MRI). By definition,
they do not cause overt neurological deficit. They have, however, been demonstrated to predict a lower intelli-
gence quotient (IQ) and also carry a higher risk of large
vessel territory ischemic stroke.2 Established risk factors
for SCI in patients with hemoglobin (Hb) SS include a
lower baseline Hb, male sex and relative hypertension,3
but there is no consensus on the effect of HbF levels.3-6
Less is known about SCI in those with HbSC genotype, however, the prevalence in children has been reported at HMIP between 5.8-13.5%.7,8 We performed a retrospective analysis of 333 patients with HbSS and 76 patients with
HbSC. We found SCI occurred far younger in HbSS, with
a hazard ratio of 3.01 against HbSC for SCI, however, the HMIP2b prevalence of SCI in our HbSC cohort was unexpectedly
high at 55%. We also showed that α thalassemia (AT)
and female sex offered protection against SCI in patients
with HbSS, but not HbSC. Additionally, we found no
influence of glucose-6-phosphate dehydrogenase (G6PD) deficiency on SCI, and no influence of measured HbF lev-
els, or genetic loci known to influence HbF levels, on SCI outcomes.
Gene
VCAM1
RS id
rs1041163
All patients
OR=1.08, P=0.675 OR=0.91, P=0.563 OR=0.99, P=0.944 OR=1.12, P=0.456 OR=0.79, P=0.081 OR=1.1, P=0.529 OR=0.8, P=0.159 OR=0.83, P=0.215 OR=1.88, P=0.347 OR=0.87, P=0.674 OR=0.87, P=0.674 OR=1.14, P=0.714 OR=1.2, P=0.592 OR=0.91, P=0.684 OR=1.01, P=0.98 OR=1.36, P=0.466
HbSS only
OR=1.19, P=0.413 OR=0.89, P=0.511 OR=1.02, P=0.919 OR=1.07, P=0.705 OR=0.76, P=0.073 OR=1.04, P=0.791 OR=0.85, P=0.374 OR=0.89, P=0.508 OR=2.31, P=0.275 OR=0.89, P=0.755 OR=0.89, P=0.755 OR=1.18, P=0.664 OR=1.25, P=0.549 OR=0.91, P=0.722 OR=1.22, P=0.593 OR=1.08, P=0.487
rs4275799 rs887614 rs3750882 rs2357790 rs6545816 rs1427407 rs11886868
g(HbF)
ADAMTS10
NOM1
FRMD4A
CACNB2
BCL11a
BCL11a
BCL11a
HBS1L-MYB rs9376090 HBS1L-MYB rs66650371
rs9399137 HMIP rs9389269 HMIP rs9402686 rs9494142 HMIP2b rs9494145
1770
Patient data came from the South East London sickle gene bank (London, UK). Written informed consent was obtained through three approved study protocols (LREC 01-083, 07/H0606/165, and 12/LO/1610) and research conducted in accordance with the Helsinki Declaration (1975, as revised 2008). Genotyping data were estab- lished for 15 million variants using the Illumina Infinium MEGA chip and imputation using 1,000genome phase 3 data on the Michigan imputation server as described pre- viously.9 AT was determined using single tube multiplex polymerase chain reaction (PCR) according to previously published methods.9 Clinical notes and neuroimaging results from the year 2000 onwards were reviewed for all patients. Evidence of SCI were determined by MRI using the accepted neuroradiological criteria3 and confirmed to have no correlating overt clinical event in the clinical notes. The age at which the first radiological evidence that an SCI had occurred was recorded. Controls were determined by MRI confirming the absence of any white matter hyperintensities. The age was defined by the most recent neuroimaging scan confirming this absence. Kaplan-Meier plots and Cox-proportionate hazard (coxPH) ratios were calculated in R 3.6.1. Linear mixed modeling was performed using genome-wide complex trait analysis (GCTA), with a genetic relatedness matrix to account for population structure. Age, sex, sickle geno- type and AT were used as covariates. The threshold for genome wide statistical significance was set at 5x10⁻⁸.
The cohort consisted of 333 patients with HbSS and 76 with HbSC genotypes. The average age was 35.8 years (yrs) (range, 11.4-78.1 yrs) in the HbSS cohort and 52.3 yrs (range, 17.6-84.2 yrs) in the HbSC cohort. Heterozygous AT (αα/-α3.7) was detected in 130 (32%) of the total cohort, and homozygous AT (-α3.7/-α3.7) in 21 (5%). The prevalence of SCI in those with HbSC was equivalent to that seen in the SCA cohort (53.4% vs. 55%), although, as demonstrated in Figure 1A, these
RS id: reference single nucleotide polymorphisms identity; HbSS: hemoglobin SS; OR: overall response.
occurred at a much later age (average age 50.6 yrs vs. 25.7 yrs). CoxPH ratios showed a hazard ratio (HR) of 3.01 for SCI in patients with HbSS than those with HbSC.
Our cohort had a slight excess of females (245) to males (164). The Kaplan-Meier plots (Figure 1B) and coxPH ratios demonstrate that males carried a higher risk for SCI (HR=1.54, 95% Confidence Interval [CI]: 1.18- 2.03, P=0.0016). Considering the two sickle genotypes individually, shown in Figure 2A and B, we found this to only be a risk factor in patients with HbSS (HR=1.86, 95%CI: 1.24-2.8, P=0.002), but not in those with HbSC (HR=0.77, 95%CI: 0.38-1.6, P=0.465). G6PD assay results were available for 321 of our cohort, including 36 with G6PD deficiency. Adding this as a covariate did not improve the model, and G6PD deficiency was not a sta- tistically significant variable (HR=1.11, 95%CI: 0.67-1.8, P=0.69). We further tested this in just the male subgroup and reached the same conclusion.
AT is a known protective factor with respect to large vessel cerebrovasculopathy in SCD, however, its effect on SCI was not known. We report an overall protective influence (HR=0.77, 95%CI, 0.6-0.99, P=0.038) on SCI occurrence. Again, we found that this influence was only seen in those with HbSS (HR=0.74, 95%CI: 0.56-0.96, P=0.026), but not those with HbSC (HR=0.91, 95% CI:0.50-1.7, P=0.774).
We also considered clinical measurements of HbF%. Methods of collection are detailed in a separate study.10 Three hundred fifty-nine patients had validated HbF measurements. The average HbF% in the HbSS cohort was 7.2% (n=292), and 1.9% (n=67) in those with HbSC. We found no association between HbF% and SCI out- comes, after adjusting for age, sex, and sickle genotype (overall response [OR]=0.80, 95%CI: 0.51-1.09, P=0.126).
We used our variant dataset to perform genome wide analysis on this patient cohort, using age at defined out- come, sex, sickle genotype and AT as covariates. We also included a genetic relatedness matrix to control for pop-
haematologica | 2021; 106(6)
