
Page 253 - 2021_06-Haematologica-web
P. 253
Letters to the Editor
(45% vs. 27% and 25% for CLL and MBL, respectively). The presence of a +sIFE was associated with a worse Eastern Cooperative Oncology Group performance status (ECOG PS), higher frequency of lymphadenopathy, more advanced Binet and Rai stages, and higher b -microglob- ulin (B2M) levels (62 vs. 42%, P<0.001). The2distribution of fluorescence in situ hybridization (FISH) abnormalities was significantly different according to the sIFE, with a higher frequency of favorable-risk FISH in –sIFE patients, and of high-risk abnormalities in +sIFE patients (P=0.032). Likewise, the proportion of patients with unmutated immunoglobulin heavy chain gene (IGHV) genes was significantly higher among patients with a +sIFE (53 vs. 37%, P=0.009). No significant differences were seen in the mutation/deletion rate of ATM, NOTCH1, SF3B1, TP53, MYD88, or BIRC3 according to the sIFE.
The proportion of patients with immunoparesis did not differ according to the sIFE. Among the 165 patients with a +sIFE at diagnosis, IgM-κ was the most common isotype (25%), followed by IgG-κ (22%), and IgG-l (21%). The frequency of other isotypes was: IgM-l (8%), IgA-κ (2%), IgA-l (2%), κ free-light chains (κ-FLC, 1%), l-FLC (6%), and bi/triclonal (11%). Among the cases in which the quantification of the sMC was available for review, most had a non-measurable sMC (positive sIFE but normal sPEP). In the remaining eight cases, the medi- an sMC was 4.3 g/L (range, 2−9.8). The information between the light chain of the serum Ig and the light chain restriction by flow cytometry was compared in 132 cases with a +sIFE: 72% were concordant and 28% were discordant. When concordance was further analyzed considering the sIFE isotype, it was found to be higher for IgM cases (89%). Protein and immunochemical features
Table 2. Treatment, response, and outcomes. Characteristic
All patients
49 (44−54)
62 (27) 41 (18) 64 (28) 26 (11) 35 (15)
101 (56) 52 (47−58) 3 (2−5)
Serum immunofixation
Negative Positive P
10-y probability of requiring treatment, % (95% CI)
Frontline treatment [n=230 (42%)], n (%) Alkylating agents +/- rituximab
Purine analogs
Purine analogs + rituximab
Novel agents
Others
Complete response, n (%)
10-y overall survival, % (95% CI)
10-y risk of Richter syndrome, % (95% CI)
48 (42−53)
44 (29) 27 (18) 42 (28) 16 (11) 24 (16)
67 (55) 57 (51−64) 3 (2−6) 23 (18−28)
52 NS (43−60)
NS
18 (24) 14 (19) 22 (29) 10 (13) 11 (15)
34 (58) NS
10-y risk of second malignancies, % (95% CI)23 (19−28)
CI: confidence interval; NS: not statistically significant. y: years.
0.003 24 (17−32) NS
42 (34−52)
3 (1−7) NS
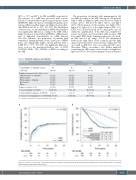
AB
Figure 1. Outcomes according to serum immunofixation. (A) Time to first treatment. (B) Overall survival (continuous lines), and survival of the sex- and age- matched general population (dashed lines).
haematologica | 2021; 106(6)
1755
