
Page 252 - 2021_06-Haematologica-web
P. 252
Letters to the Editor
Serum monoclonal component in chronic lymphocytic leukemia: baseline correlations and prognostic impact
The first report analyzing the presence of a serum monoclonal component (sMC) in patients with lymphoid malignancies was published in 1957.1 Since then, the identification of a sMC in other lymphoid neoplasms has awakened interest, mainly due to its relationship with B- cell biology and its adverse prognostic impact in some entities, such as diffuse large B-cell lymphoma.2–4 To date, five reports have employed serum immunofixation elec- trophoresis (sIFE) to study the presence of a sMC in chronic lymphocytic leukemia (CLL).5–10 In the largest of these studies, containing 133 patients, Xu and colleagues reported a prevalence of 20%, and correlated the pres- ence of a sMC with advanced stage, adverse prognostic features, and worse overall survival (OS).9 To our knowl- edge, the present study represents the largest series ana- lyzing the prevalence and prognostic impact of a sMC in CLL. Found in 30% of patients at diagnosis, it is associat- ed with clinical, biological and genetic adverse prognostic features, and shorter OS and relative survival, with a comparable time to first treatment (TTFT), risk of Richter syndrome (RRS), and risk of second malignancies (RSM).
We studied 548 patients diagnosed with CLL (n=340), CLL-type monoclonal B-cell lymphocytosis (MBL, n=108), or small lymphocytic lymphoma (SLL, n=93) at a single institution between 1997 and 2018, with available data on sIFE at diagnosis. The study was conducted according to the Hospital Clínic de Barcelona Institutional Review Board and in accordance with the Declaration of Helsinki. Serum protein electrophoresis
(sPEP) and sIFE were performed at diagnosis in all patients. A non-measurable sMC was defined as a posi- tive sIFE but normal sPEP. A biclonal sIFE was defined as the presence of two heavy or light chains on the sIFE. Immunoparesis was defined as a decreased level of at least one of the three immunoglobulin (Ig) classes. Light chains were considered concordant if the light chains of the sIFE matched the light chain restriction by flow cytometry of the peripheral blood and/or bone marrow.
In order to estimate TTFT, RRS and RSM, in which death without the primary event is possible, cumulative incidence was calculated (cmprsk package, R software, Vienna, Austria) and compared by use of Gray’s test. In order to compare the OS observed in our cohort with that of the general population, patients were matched by age and sex with Spanish individuals from the Human Mortality Database,11 which provides an estimate of the cause-specific survival through relative survival analysis (relsurv package, R software, Vienna, Austria). Excess mortality (also called survival reduction), expressed as a percentage, was calculated with the following formula: [1–(cohort survival/population survival)] x 100, and was intended to reflect the reduction in life expectancy with respect to the general population. Variables that had a significant impact on OS were used to construct a multi- variate Cox proportional hazards regression model. P-values <0.05 were considered to indicate statistical sig- nificance.
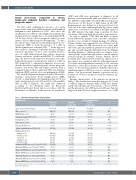
Baseline characteristics of the patients are shown in Table 1. One hundred and sixty-five patients (30%) had a +sIFE at diagnosis. Patients with a +sIFE were signifi- cantly older (median age 70 years [y] vs. 66 y, P=0.007), and the prevalence of a +sIFE increased with age. Patients diagnosed with SLL had a higher prevalence of a +sIFE
Table 1. Baseline characteristics of the patients Characteristic
Serum immunofixation Positive (n=165, 30%)
70 (32-97)
101 (61) 25 (16) 66 (70)
Age in years, median (range)
All patients (n=548)
67 (30-97)
324 (59) 44 (9) 191 (57) 20 (4) 26 (5) 30 (6) 257 (48)
145 (29) 203 (41) 75 (15) 49 (10) 21 (4) 139 (42)
17 (7) 31 (11) 26 (9) 20 (8) 1 (1) 4 (4)
Negative (n=383, 70%)
66 (30-92)
223 (58) 19 (5) 125 (52) 13 (4) 12 (3) 12 (3) 158 (42)
105 (31) 146 (43) 51 (15) 229 (9) 9 (3) 87 (37)
11 (6) 19 (9) 17 (9) 14 (7) 1 (1) 3 (4)
P
0.007
NS <0.001
Male sex, n (%)
ECOG PS ≥1, n (%) Lymphadenopathy (CT), n (%) B symptoms, n (%)
Binet stage C, n (%)
Rai stage III-IV, n (%)
0.003 7(5) NS
14 (9) 0.007
b2-microglobulin above ULN, n (%)
18 (11) 99 (62)
<0.001 <0.001 0.032
FISH [n=493 (90%)] normal, n (%) del(13q), n (%) +12, n (%) del(11q), n (%) del(17p), n (%)
Unmutated IGHV genes, n (%) [n=333 (61%)] Abnormal ATM gene, n (%) [n=237 (43%)] Mutated NOTCH1 gene, n (%) [n=288 (53%)] Mutated SF3B1 gene, n (%) [n=276 (50%)] Abnormal TP53 gene, n (%) [n=268 (49%)] Abnormal BIRC3 gene, n (%) [n=102 (19%)]
Mutated MYD88 gene, n (%) [n=102 (19%)]
40 (26)
57 (37)
24 (16)
20 (13)
12 (8)
52 (53) 0.009
6 (9) NS 12 (15) NS 9 (12) NS 6 (8) NS 0 NS 1 (3) NS
1754
ECOG PS: Eastern Cooperative Oncology Group Performance Status; CT: computed tomography; ULN: upper limit of normal; FISH: fluorescence in situ hybridization; NS: not statistically significant.
haematologica | 2021; 106(6)
