
Page 249 - 2021_06-Haematologica-web
P. 249
Letters to the Editor
hence only the main cohort effect was retained. The change in eGFR over time was -2.66 mL/min/1.73 m2 per year (95%CI: -3.19 to -2·13; P<0.0001).
Rapid decline of kidney function, defined as eGFR loss >3.0 mL/min/1.73 m2 per year, was observed in 216 patients (35.6%), and in 149 patients (24.6%) when defined as eGFR loss >5.0 mL/min/1.73 m2 per year (Online Supplementary Table S2). CKD progression was observed in 130 of 606 patients (21.5%), defined as eGFR decline to <90 mL/min/1.73 m2 and at least 25% decline from baseline, and in 55 of 606 patients (9.1%) defined as eGFR decline to <90 mL/min/1.73 m2 and at least 50% decline from baseline. Using a threshold of >3.0 mL/min/1.73 m2 per year, 96 of 216 patients (44.4%) with rapid decline had CKD progression defined as ≥25% eGFR decline from baseline, while 48 of 216 patients (22.2%) had CKD progression defined as ≥50% eGFR decline from baseline. Using a threshold of >5.0 mL/min/1.73 m2 per year, 76 of 149 patients (51.0%) with rapid decline had CKD progression defined as ≥25% eGFR decline from baseline, while 43 of 149 patients (28.9%) had CKD progression defined as ≥50% eGFR decline from baseline.
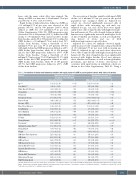
The association of baseline variables with rapid eGFR decline (>3.0 mL/min/1.73 m2 per year) in the pooled population was examined (Table 2). Adjusted for cohort, we observed significantly increased odds of rapid decline with increasing age and male sex. Adjusted for age, sex, and cohort, there were signifi- cantly lower odds of rapid decline with higher hemoglo- bin and hematocrit. The odds of rapid decline in kidney function were significantly increased with higher levels of direct bilirubin and ferritin, as well as hemoglobin- uria, history of stroke and use of ACE inhibitors/angiotensin receptor blockers.
Adjusted for cohort, we similarly observed signifi- cantly increased odds of rapid decline, using a threshold of >5.0 mL/min/1.73 m2 per year, with increasing age (Table 2). Adjusted for age, sex, and cohort, there were lower odds of rapid decline with higher hemoglobin and hematocrit. The odds of rapid decline were significantly increased with higher baseline blood urea nitrogen, direct bilirubin and ferritin, as well as hemoglobinuria, proteinuria, and history of stroke. Associations of covariates with rapid decline in individual cohorts are shown in the Online Supplementary Table S3. Using a
Table 2. Association of clinical and laboratory variables with rapid decline of eGFR in pooled patient cohorts with sickle cell anemia.
Variable*
Age**
Sex (Male)**
Rapid decline based on >3.0 mL/min/1.73 m2 threshold
Odds ratio (95% CI) P 1.03 (1.01, 1.04) 0.0011
1.40 (1.0, 1.96) 0.05
Rapid decline based on >5.0 mL/min/1.73 m2 threshold
Odds ratio (95% CI) P 1·02 (1.003, 1.04) 0.02
1.25 (0.86, 1.82) 0.24
White Blood Cell Count 0.99 (0.94, 1.03) 0.52 0.99 (0.95, 1.04) 0.80 Hemoglobin 0.89 (0.79, 0.996) 0.042 0.80 (0.70, 0.92) 0.0012
Hematocrit 0.96 (0.92, 0.995) 0.029 0.93 (0.89, 0.98) 0.0029 Reticulocyte Count 1.0 (0.999, 1.001) 0.99 1.001 (0.999, 1.002) 0.39
Platelet Count 0.999 (0.998, 1.0) 0.14 0.999 (0.998, 1.001) 0.36 Baseline eGFR 1.0 (0.99, 1.01) 0.91 0.997 (0.991, 1.004) 0.44
Blood Urea Nitrogen 1.04 (0.99, 1.08) 0.054 1.06 (1.01, 1.098) 0.0089 Total Bilirubin 1.02 (0.95, 1.09) 0.58 1.05 (0.98, 1.13) 0.21
Direct Bilirubin 1.74 (1.01, 2.97) 0.044 1.99 (1.15, 3.43) 0.013 Indirect Bilirubin 1.02 (0.90, 1.16) 0.72 0.98 (0.85, 1.13) 0.79
Ferritinφ 1.02 (1.01, 1.03) 0.0037 1.02 (1.01, 1.03) 0.0037 Hemoglobinuria 2.16 (1.24, 3.78) 0.007 3.20 (1.79, 5.73) <0.0001
Proteinuria≠ 1.68 (0.94, 2.99) 0.08 2.48 (1.34, 4.58) 0.0037 Albumin-Creatinine Ratio≠≠ 1.0 (0.998, 1.003) 0.80 1.0 (0.998, 1.003) 0.77
Hemoglobin F 0.99 (0.96, 1.02) 0.42 0.99 (0.96, 1.02) 0.48 Weight 1.0 (0.99, 1.01) 0.94 0.996 (0.98, 1.01) 0.55
H/O Acute Chest Syndrome 1.25 (0.82, 1.92) 0.30 1.45 (0.90, 2.35) 0.13 H/O Stroke 2.13 (1.36, 3.34) 0.001 1.77 (1.09, 2.88) 0.021
H/O Leg Ulcers 1.29 (0.77, 2.17) 0.33 1.31 (0.74, 2.32) 0.35 H/O Avascular Necrosis 0.92 (0.59, 1.43) 0.70 0.77 (0.47, 1.28) 0.32
Systolic Blood Pressure 1.01 (0.99, 1.02) 0.31 1.01 (0.99, 1.02) 0.33 Diastolic Blood Pressure 1.01 (0.99, 1.02) 0.44 1.01 (0.99, 1.02) 0.60
H/O Diabetes 0.95 (0.26, 3.47) 0.94 0.65 (0.13, 3.19) 0.60 Chronic RBC Transfusion 1.47 (0.81, 2.68) 0.20 1.39 (0.74, 2.64) 0.31
Hydroxyurea Therapy 1.28 (0.90, 1.83) 0.18 1.20 (0.81, 1.79) 0.37 RAAS Blocking Agents 2.17 (1.04, 4.53) 0.04 1.88 (0.86, 4.09) 0.11
*Results adjusted for age, sex and cohort effects, except that **are adjusted only for cohort effects; RAAS blocking agents: renin-angiotensin-aldosterone system blocking agents (Angiotensin-converting enzyme inhibitors and angiotensin receptor blockers); ≠proteinuria (at least 1+ by dipstick urinalysis); ≠≠available in only the UIC cohort; φodds ratio is provided for 100 ng/mL increase in ferritin.
haematologica | 2021; 106(6)
1751
