
Page 185 - 2021_06-Haematologica-web
P. 185
B-cell content in advanced-stage cHL
(P=0.04, HR=2.372, 95% CI: 0.996-5.651) were signifi- cantly worse in patients presenting with low B-cell con- tent (Figures 3A and 4A). We next examined the prognos- tic value of B-cell content in a multivariate model, includ- ing 11 known risk factors for progression-free survival and B-cell content as binary variables. Backward selection of effects with P-values <0.1 resulted in elimination of nine effects (extranodal disease, lymphopenia, stage IV disease, albumin <4 g/dL, leukocytosis, B-symptoms, elevated ery- throcyte sedimentation rate, hemoglobin <10.5 g/dL, large mediastinal mass) and a final model including B-cell con- tent ≤21% (P=0.0002, odds ratio [OR]=3.133, 95% CI: 1.726-5.687), male sex (P=0.0015, OR=2.251, 95% CI: 1.363-3.720) and age ≥45 years (P=0.056, OR=1.837, 95% CI: 0.985-3.425) as risk factors for treatment failure.
B-cell content was associated with progression-free and overall survival in an Independent validation cohort
To validate whether low B-cell content at diagnosis, as determined by WSI, could predict survival in an independ- ent validation cohort, we analyzed 147 patients treated within the HD18 trial.21 In line with the results observed in our study cohort, B-cell content at diagnosis was lower in patients who had progressive disease than in patients with long-lasting complete remission (mean 16.4% vs. 21.5%, respectively; P=0.0616) (Table 3). cHL patients in the validation cohort with a low B-cell content (most strin- gent cut-off value of 10%) had a worse progression-free survival (P=0.04, HR= 1.981, 95% CI: 1.104-3.557) (Figure 3B) and inferior overall survival (P=0.01, HR= 3.598, 95% CI: 1.205-10.739) compared to patients with a high B-cell count (Figure 4B).
Phenotype and distribution of B cell in classical Hodgkin lymphoma
B cells and macrophages were extremely unevenly dis- tributed over lymph node tissues but did not reflect unaf-
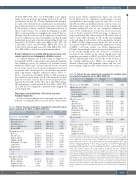
Table 1A. Patients’ baseline characteristics comparing the study cohort and all patients randomized into HD12 and HD15 GHSG trials.
fected tissue (Online Supplementary Figures S2 and S3). Visual inspection by experienced pathologists revealed non-infiltrated, pre-existing tissue in only 15% of cases (24/154) and the non-infiltrated tissues in these cases usu- ally represented only a small fraction of the lymph node (median unaffected area in not-completely infiltrated cases, 10%). Furthermore, we did not detect an associa- tion of B-cell content by WSI and stage of disease for stages included in this cohort (stages II, III and IV; data not shown). Since WSI subsumes B cells in the whole lymph node, including B-cell nodules with considerable distance to HRSC (Online Supplementary Figure S4), we tested an association with B-cell content in the immediate vicinity of HRSC (<100 mm radius) (see Online Supplementary Methods). Interestingly, despite the uneven distribution of B cells in the lymph node, we observed a correlation between B-cell content in the whole lymph node and immediate proximity to HRSC (ρ=0.676, P<0.0001, n=41) (Online Supplementary Figure S5). B cells at the borders of the nodular infiltration by HRSC are arranged in ill- defined follicles that lack germinal centers and are com- posed mainly of IgD-positive follicle mantle cells, some of
Table 1B. Patients’ baseline characteristics comparing the validation cohort and all patients randomized into the HD18 GHSG trial.
Patients’ characteristics of validation cohort
Age in years, median (IQR)
Validation cohort (N=147)
33 (25-42)
28 (19.0) 128 (87.1) 37 (25.2) 93 (63.3)
96 (66.0) 26 (17.7) 53 (36.1) 85 (87.5) 28 (19.0) 30 (20.4) 10 (6.8)
92 (63.0)
54 (37.0)
72 (49.0) 25 (17.0) 4 (2.7) 0
Randomized cohort (N=2101)
32 (24-43)
407 (19.4) 1809 (86.1) 592 (28.2) 1332 (63.4)
1278 (60.8) 437 (22.4) 765 (36.4) 1180 (56.2) 379 (18.0) 436 (20.8) 151 (7.2)
1206 (61.9)
741 (38.1)
747 (35.6) 245 (11.7) 29 (1.4) 8 (0.4)
P
0.8322
1 0.8053 0.4473 0.9295
0.1900 0.2156 1 0.7305 0.7390 1
1
0.8598
0.0006 0.0447 0.1402 1
GHSG risk factors, n(%) Extranodal disease
≥3 nodal areas
Large mediastinal mass Eelevated ESR
IPS risk factors, n(%) Male sex
Patients’ characteristics
Age in years - median (IQR)
GHSG risk factors, n(%) Extranodal disease
≥3 nodal areas
Large mediastinal mass Elevated ESR
Study cohort (n=340)
31 (24-40)
64 (18.8) 304 (89.4) 106 (31.2) 248 (72.9)
205 (60.3) 53 (15.6) 142 (41.8) 192 (56.5) 56 (16.5) 77 (22.6) 23 (6.8)
204 (60.0)
136 (40.0)
221 (65.0) 100 (29.4) 9 (2.6) 4 (1.2)
Randomized cohort N=3426
33 (25-42)
693 (20.3) 2884 (84.3) 1024 (30.1) 2310 (69.5)
2059 (60.1) 719 (21.0) 1198 (35.0) 1796 (55.1) 617 (18.1) 700 (20.5) 261 (8.0)
1721 (55.8)
1069 (34.6)
1778 (51.9) 780 (22.8) 73 (2.1) 35 (1.0)
P*
0.0093**
0.5226 0.0058 0.6631 0.1532
0.9535 0.0094 0.0069 0.6044 0.4579 0.3220 0.4586
0.5553
<0.0001 0.0027 0.4319 0.7734
Age ≥45 years
Clinical stage IV Albumin < 4 g/dL Hemoglobin < 10.5 g/dL Leukocytosis Lymphopenia
IPS score, n(%) 0-2
3-7
IPS risk factors, n(%) Male sex
Histological subtype - N/125 (%) Nodular sclerosis Mixed-cellularity Lymphocyte-rich Lymphcyte-depleted
Age ≥45 years
Clinical stage IV Albumin <4 g/dL Hemoglobin <10.5 g/dL Leukocytosis Lymphopenia
HD12 trial: number of patients per arm (study cohort/randomized cohort): arm A 39/336, arm B 59/357, arm C 47/353, arm D 44/349. Chemotherapy: arms A and B: 8 cycles of escalated BEA- COPP (eBEACOPP), arms C and D: 4 cycles of eBEACOPP + 4 cycles of baseline BEACOPP. Radiotherapy: arms A and D: 30 Gy to initial bulky sites and residual lymphoma. HD15 trial: number of patients per arm: arm A 64/677, arm B 69/680, arm C 73/674. Chemotherapy: arm A: 8 cycles of eBEACOPP, arm B: 6 cycles of eBEACOPP, arm C: 8 cycles of BEACOPP14. Radiotherapy: arms A, B, and C: 30 Gy consolidating radiotherapy to positron emission tomog- raphy (PET)-positive residues. HD18 trial: number of patients per arm (validation cohort/enrolled or randomized cohort): NULL 9/137, arm A 67/731, arm B 15/220, arm C 27/508, arm D 29/505. NULL not randomized arm: without PET result after 2 cycles of eBEACOPP. Chemotherapy for PET-positive arms A: 6-8 cycles of eBEACOPP and B: 6-8 cycles of eBEACOPP + rituximab; and for PET-negative arms C: 6-8 cycles of eBEACOPP and D: 4 cycles of eBEACOPP. Radiotherapy (30 Gy) was recommended for all arms with residual 18F-FDG uptake and a mass with a largest diameter after chemotherapy of at least 2.5 cm. P values are for the comparison of patients included in the study or validation cohort versus patients not included. *Fisher exact test, if not stated otherwise, **Wilcoxon rank-sum test, IQR: interquartile range; ESR: ery- throcyte sedimentation rate; IPS: International Prognostic Score: GHSG: German Hodgkin Study Group.
IPS score, n(%) 0-2
3-7
Histological subtype, n(%) Nodular sclerosis Mixed cellularity Lymphocyte-rich Lymphcyte-depleted
haematologica | 2021; 106(6)
1687
