
Page 148 - 2021_06-Haematologica-web
P. 148
M. Xie et al.
A
B
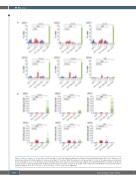
Figure 2. Single-cell culture of six populations. (A) Percentage of cells that underwent divisions is shown as mean±standard deviation (SD). (n=5). Number of cell division was estimated from the number of cells per well at days 1-7 of culture. When the number of cells per well was 1, 2, 3-4, or ≥5, single cells were considered to have undergone 0, 1, 2, or ≥ 3 division(s), respectively. Wells that had no cells were excluded from this analysis. Two-way ANOVA with Tukey’s multiple comparisons test was used for statistical analysis. (B) Cell number per well at day 7 of culture is shown as mean±SD. (n=5). Unpaired t-test with Welch’s correction was used for statistical analysis. *P<0.05; **P<0.01; ***P<0.001; and ****P<0.0001; ns: not significant.
1650
haematologica | 2021; 106(6)
