
Page 124 - 2021_06-Haematologica-web
P. 124
R. Famà et al.
Results
In silico prediction of endothelial transcription factors involved in F8 promotor regulation
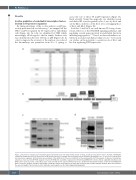
By taking advantage of the in silico analysis on pF8 pre- viously performed in our laboratory,23 we mapped all the TFBS on pF8 recognized by TF expressed by endothelial cells (Figure 1A). In total, we identified 16 TFBS which interestingly all belonged to the Ets family. Further, each was distributed in the first -600 bp of pF8 (Figure 1A). In order to improve the accuracy of the analysis, we reduced the dissimilarity rate parameter from 5 to 3, opting to
assess the role of these TF in pF8 regulation (Figure 1A, black asterisk). Using this approach, we identified seven endothelial BS, four recognized by Ets-1, two by Ets-2 and one by Elk-1, with two of the Ets-1 sites overlapping those of Ets-2 and Elk-1 (Figure 1B).
Both Ets-1 and Ets-2 are well-known TF, being down- stream effectors of the RAS/ERK signaling pathways and regulating several genes involved in endothelial functions including angiogenesis.28–31 Based on their redundant con- tribution in crucial endothelial cell processes,28 we focused our studies on the potential co-operative role of Ets-1 and Ets-2 in regulating FVIII expression.
A
B
C
D
Figure 1. F8 promoter showing several putative E26 transformation-specific (Ets) binding motifs for Ets-1 and Ets-2 transcription factors. (A) Table showing the endothelial binding sites (BS) on F8 promoter (pF8) identified by in silico analysis. Black asterisks indicate BS with a dissimilarity score <3 selected to evaluate their role in promoter regulation. (B) Schematic representation of the distribution of the selected Ets-BS on the proximal pF8 (-1,175 basepairs). (C) Reverse transcriptase polymerase chain reaction (RT-PCR) analysis of factor VIII (FVIII), Ets-1 and Ets-2 expression in ECV-304 and HEK293T cell lines. Blood outgrowth endothelial cells (BOEC), were used as positive control. Base pairs on the left indicate the expected PCR products size. (D) Western immunoblot analysis on ECV-304 and HEK293T whole cell lysates using the anti-Ets-1 and anti-Ets-2 antibodies. Black arrows indicate the major Ets-1 isoforms p51 (51 kDa) and p42 (42 kDa). Black lines indicated the expected weight of protein detected (for antibodies and reagents see the Online Supplentary Appendix).
1626
haematologica | 2021; 106(6)
