
Page 117 - 2021_06-Haematologica-web
P. 117
Hypofibrinolytic effects of complement C3 and its modulation
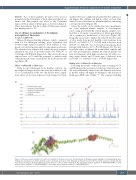
P02675). Two of these peptides (B and C) were in close proximity in the N terminus of the b-chain and shared one amino acid. One peptide was closer to the C-terminal region of the b chain of fibrinogen, as shown in Figure 2. These data indicate that the b chain of fibrinogen contains key binding sites for C3.
Use of affimers for modulation of C3-induced prolongation of fibrinolysis
Isolation of affimer A6
Sixteen fibrinogen-binding affimers, which competed with C3 for fibrinogen binding, were sequenced and revealed eight distinct sequences. Each affimer is com- posed of a scaffold protein and two nine amino acid loops. We identified one affimer (A6) which showed sequence identity in one of its loops with residues Ser 38-His 47 of C3 (Uniprot ID P01024) (Figure 3A). This site resides in an exposed area of C3 with the potential to interact with other plasma proteins, as predicted by molecular model- ing (Figure 3B).
Effects of affimer A6 on fibrinolysis
Using pooled fibrinogen from healthy controls, we investigated changes in lysis time after the addition of A6, C3 or a combination of the two. A6 did not have a signif- icant effect on clot lysis whereas C3 prolonged clot lysis,
A
B
Figure 2. Fibrinogen peptide binding to C3 and location within the fibrinogen molecule. (A) Intensity plot of fibrinogen peptide binding to C3 showing mainly three binding sites (visualized as 3 distinct intensity peaks, red arrows), all located on the fibrinogen b chain (A, B and C). (B) The peptide sequences identified by the microarray screening are illustrated within the crystal structure of the β chain of fibrinogen. The red spheres indicate peptide A (136AVSQTSSSSFQYMYL150), pink spheres indicate peptide B (423QCSKEDGGGWWY434) and orange spheres indicate peptide C (434YNRCHAANPNGR445).
an effect that was completely abolished by the addition of A6 (Figure 4A). Affimer A6 had no effect on lysis time when C3 was substituted by plasmin inhibitor, indicating a C3-specific effect (Figure 4A).
Given the results of the purified protein experiments, we next analyzed plasma samples. A dose-response curve, using pooled healthy control plasma samples, veri- fied that a 1:1 molar concentration of fibrinogen:affimer A6 is optimal for modulation of clot lysis (Figure 4B). Using this molar ratio, affimer A6 reduced the lysis time of clots made from pooled healthy control plasma from 593±17 s to 542±10 s (7%, P<0.05) with a decrease from 618±13 s to 548±15 s for clots made from plasma from patients with diabetes (11%, P<0.05) (Figure 4C). We also tested the effect of affimer A6 in individual samples and not only pooled plasma. Affimer A6 reduced plasma clot lysis in 24 patients with high vascular risk (11 with coro- nary artery disease and 13 with type 2 diabetes) from 1237±150 s to 1120±129 s (10%, P<0.05) (Figure 4D).
Binding sites of affimer A6 on fibrinogen
Following the results of the microarray screening of C3 and fibrinogen, the sequences for the two random loops of A6 were individually entered into the Pepsite2 webserver to predict where A6 might be binding to the b-chain of fibrinogen (PDB code 3GHG; 18). The strongest binding
haematologica | 2021; 106(6)
1619
