
Page 116 - 2021_06-Haematologica-web
P. 116
R.J. King et al.
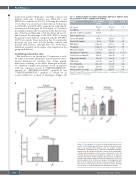
made from purified fibrinogen of healthy controls and patients with type 1 diabetes was 2510±132 s and 2857±151 s, respectively (P=0.07). Following the addition of C3, there was an increase in lysis time in both groups to 2705±180 s and 3379±259 s, respectively, with individ- ual data provided in Figure 1A. The degree of C3-induced prolongation in lysis time was greater in the diabetes sam- ples (179±101 and 522±166 s; P=0.04) (Figure 1B and C), and showed a broader range of 144-1476 s (5-51%) among the patients with diabetes, compared with the 108-480 s (5-18%) in controls. These data show that C3 consistently prolongs clot lysis time in both healthy controls and patients with diabetes, although there was wider inter- individual variability in the degree of prolongation in the group with diabetes.
C3-fibrinogen interaction sites
Our data have so far shown that C3 represents a credi- ble target to modulate fibrinolysis and we therefore inves- tigated fibrinogen-C3 binding sites. Using peptide microarray screening of the whole fibrinogen molecule, we identified complex spot patterns, based on peptides with the consensus motifs A136VSQTSSSSFQYMYL150 (peptide A), 423QCSKEDGGGWWY434 (peptide B) and 434YNRCHAANPNGRYY447 (peptide C), which are all located within the b chain of fibrinogen (Uniprot ID
Table 1. Clinical variables of controls and patients with type 1 diabetes. Data are presented as mean ± standard error of mean.
Variable
Age (years)
Sex (M/F, n)
Duration of diabetes (months) Current smokers (n)
Systolic BP (mmHg)
Diastolic BP (mmHg)
BMI (kg/m2)
C3 (mg/mL)
Fibrinogen (mg/mL)
Plasma glucose (mmol/L) Total cholesterol (mmol/L) Triglycerides (mmol/L)
TSH (mU/L)
Free T4 (pmol/L)
Creatinine (mmol/L)
Plasma clot lysis (seconds)
Type 1 diabetes (n=12)
25.1±1.7
7/5
108±68
2
119±4.6
76±4
25.4±0.96
1.34±0.06
2.0 (±0.32)
12.8±1
4.8±0.35
1.3±0.15
2.5±0.32
14.3±0.39
76.8±4.6
427.5±14.6
Controls (n=12)
27.9±1.3
9/3
-
0
121±3.8
76±2.5
23.5±0.6
1.39±0.07
2.2 (±0.27)
4.4±0.2
4.8±0.32
1.1±0.11
2.1±0.18
15±0.45
81±4.2
425±7.9
P value 0.2
0.73 0.85 0.12 0.54 0.2 <0.0001 0.97 0.16 0.33 0.24 0.52 0.88
C
M: male, F: female; BP: blood pressure; BMI: body mass index; C3: complement C3; TSH: thyroid- stimulating hormone,T4: thyroxine.
AB
Figure 1. C3 modulation of clot lysis in individuals with diabetes and healthy controls. Fibrinogen and C3 were purified from matched sam- ples of 12 patients with diabetes and 12 healthy controls. Turbidimetric experiments were conducted on individual fibrinogen samples after the addition of thrombin, calcium, tissue plasminogen activator and plasminogen, in the presence and absence of C3. (A) Clot lysis time was increased following the addition of C3 when all samples (n=24) were analyzed together. (B) Lysis time of individual samples from healthy controls and patients with diabetes before and after the addition of C3 (n=12 in each group), (C) Prolongation in lysis time by C3 in samples from healthy controls and patients with dia- betes (n=12 in each group). Data are presented as mean ± standard error of mean. Co: controls; DM: patients with diabetes mellitus.
1618
haematologica | 2021; 106(6)
