
Page 73 - 2021_05-Haematologica-web
P. 73
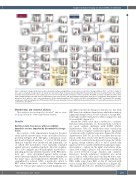
Impact of donor biology on stored RBC metabolism
Figure 2. Metabolic changes in glycolysis, pentose phosphate pathway and glutathione homeostasis as a function of storage additives (AS-1 – left; AS-3 – right). On the x axis of each graph, storage day 10, 23 and 42 are represented. Each dot represents an independent measurement and colors are proportional to the oxidative hemolysis measurement for the same sample (green to red = low to high oxidative hemolysis). 5-OXO: 5-oxoproline; ASC:DHA: ascorbate to dehydroascorbate ratios; DPG: 2,3-diphosphoglycerate; FBP: fructose bisphosphate; HCY: homocysteine; G3P: glyceraldehyde 3-phosphate; G6P: glucose 6-phosphate; GLN: glutamine; GLU: glutamate; GLUC: glucose; GSH: reduced glutathione; GSSG: oxidized glutathione; LAC: lactate; LAC-GSH: lactoyl-glutathione; MET: methionine; PEP: phospho- enolpyruvate; PGLY: phosphoglycerate; PYR: pyruvate; RibP: ribosome phosphate (isomers); SAM/SAH: S-adenosylmethionine to S-adenosylhomocysteine ratios; S7P: sedoheptulose phosphate.
Metabolomics and statistical analyses
These analyses were performed as described36 and are exten- sively reported in the Online Supplementary Methods.
Results
Red blood cells from donors with low oxidative hemolysis are less impacted by the metabolic storage lesion
An overview of the experimental design for the pilot study and the metabolomics study on recalled donors is provided in Figure 1A-B. Through a combination of tar- geted and untargeted analyses,36 a total of 19,264 unique chemical formulae were monitored and quantified, out of which 363 metabolites were manually validated against in-house available standards. Absolute quantita- tion of 50 oxylipids and 45 hydrophilic metabolites – including previously identified markers of the RBC meta- bolic age6 - were determined against stable isotope- labeled internal standards. Metabolites were identified at the intact mass and fragmentation (MS/MS) level, as exemplified by reduced GSH - a metabolite critical to RBC redox homeostasis - in the Online Supplementary Figure S1. Volcano plot analyses revealed minimum stor-
age-induced metabolic changes at day 42 versus day 10 in RBC from low oxidative hemolysers, while thousands of significant changes were observed in end of storage RBC from high oxidative hemolysers when compared to day 10 stored RBC (Figure 1C).
Metabolite levels were thus correlated to oxidative hemolysis measurements, i.e., the propensity to hemol- yse upon oxidant challenge with AAPH (Online Supplementary Table S1). Metabolites were sorted from positive (red) to negative correlations (green - Spearman correlation) with oxidative hemolysis (Figure 1D; Online Supplementary Table S1). In order to facilitate the visuali- zation of the data, results were plotted as heat maps, as a function of oxidative hemolysis and storage day (white to green), storage additives (AS-1 vs. AS-3, a previously appreciated36 key variable identified by principal compo- nent analysis – indent on the right), and relative abun- dance (low to high = green to red). A positive correlation was noted between storage duration and oxidative hemolysis, though significant variability was noted across donors, with some day 23 and day 42 donor sam- ples with low oxidant hemolysis clustering with day 10 RBC, while some donor RBC at day 10 clustered with end of storage RBC from low oxidant donors (Figure 1E). This analysis allowed us to identify key pathways corre-
haematologica | 2021; 106(5)
1293
