
Page 72 - 2021_05-Haematologica-web
P. 72
A. D’Alessandro et al.
AB
CD
E
F
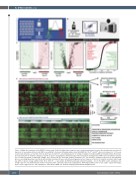
Figure 1. Within the framework of the REDS-III Omics study, 13,800 healthy donor volunteers were enrolled and donated a unit of blood, which was stored for 42 days prior to measuring red blood cells (RBC) susceptibility to hemolysis following oxidative insult with AAPH (A). The 5th and 95th extreme hemolyzers (n = 200) were recalled and donated a second unit of blood, which was stored for 10, 23 and 42 days prior to testing of oxidative hemolysis (AAPH) and metabolomics (B). Volcano plot representation of metabolic changes at day 42 vs day 10 clearly indicate minimal storage-induced metabolic derangements in RBC from low oxidative hemolyz- ers (C), while thousands of significant changes were observed in RBC from high oxidative hemolyzers (D). Top metabolic changes positively (red) and negatively (green) correlating (Spearman correlation) with oxidative hemolysis (D) were determined and graphed as heat maps, as a function of oxidative hemolysis and storage day (white to green), storage additives AS-1 (E) vs. AS-3 (F) – a key variable identified by principal component analysis – box on the right), relative abundance (low to high = green to red). Abbreviations: 5-OXO: 5-oxoproline; ADO: adenosine; GSH: reduced glutathione; HYPX: hypoxanthine; LAC: lactate; LogFC: -log(2) fold-change; ROS: reactive oxygen species; S1P: sphingosine 1-phosphate; AAPH: 2,2'-azobis-2-methyl-propanimidamide dihydrochloride.
1292
haematologica | 2021; 106(5)
