
Page 248 - 2021_05-Haematologica-web
P. 248
Letters to the Editor
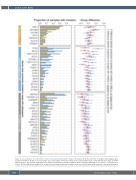
Figure 2. Gene mutations associated with central nervous system and systemic relapse. The barplot shows the proportion of samples harboring given gene mutations. Shown are 45 genes. The total sample size is 223 samples (n=72 with central nervous system [CNS] relapse, n=62 with systemic relapse and n=89 without relapse). The line plot shows differences between proportions of mutated samples, when comparing either CNS vs. no relapse, or systemic vs. no relapse. The lines indicate the ranges of the credible intervals for group differences, and the small circles represent the point estimates of the group differences.
1468
haematologica | 2021; 106(5)
