
Page 242 - 2021_05-Haematologica-web
P. 242
Letters to the Editor
in tumors from MYC-ER;CK2αwt fish (Online Supplementary Figure S4A). In order to determine whether increased phosphorylation of MYC led to the stabiliza- tion of MYC protein in vivo, we analyzed the half-life of MYC-ER protein in the presence or absence of CK2α overexpression in zebrafish developing lymphocytes. We isolated premalignant thymocytes from 5-week-old MYC-ER and MYC-ER;CK2αwt fish, dissociated the thy- mocytes, and treated them with cycloheximide (CHX) to inhibit protein synthesis. Western blotting analysis was then performed to measure MYC-ER protein levels at dif- ferent time points. We found that MYC-ER was stabi- lized in lymphocytes with CK2α overexpression, com- pared to those without CK2α overexpression (Online Supplementary Figure S4B). In order to understand whether CK2 can promote MYC-mediated leukemogen- esis through other mechanisms, we performed quantita-
tive RT-PCR analysis of zebrafish homologs of human anti-apoptotic genes, BCL2, BCL-XL, and MCL1. No sig- nificant difference was found in leukemic cells from MYC-ER versus MYC-ER;CK2αwt fish (Online Supplementary Figure S5). Together, these data indicate that CK2’s ability in phosphorylating and stabilizing MYC in vivo serves as one mechanism to promote leukemia initiation and aggressiveness.
In order to determine whether overexpression of CK2α alleviates the necessity of MYC in established tumors, we treated fish with 4HT starting at 5 dpf for 11 weeks to induce tumor development. We then removed 4HT from MYC-ER and MYC-ER;CK2αwt tumor fish to inactivate MYC and monitored disease regression for 8 weeks by fluorescent imaging (Figure 3A). We categorized tumor phenotypes based on the extent of change in tumor size as previously described: complete regression, partial
A
B
C
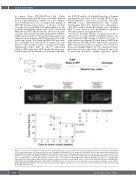
Figure 1. Overexpression of wild-type but not enzyme dead CK2α promotes the onset of MYC-induced acute lymphoblastic leukemia in zebrafish. (A) Diagram of the experimental design. (B) Thymic fluorescence in the Tg(rag2:MYC-ER;lck:EGFP) (left), Tg(rag2:MYC-ER;lck:EGFP;lck:CK2αwt; rag2:mCherry) (middle), and Tg(rag2:MYC-ER;lck:EGFP;lck:CK2αK68M;rag2:mCherry) (right) fish raised in 129 nM 4-hydroxytamoxifen (4HT) at 12 weeks of life. One representative fish is shown for each group. (C) Kaplan-Meier analysis of tumor-free fish revealed that overexpression of CK2αwt but not CK2αK68M significantly accelerated the onset of MYC-induced acute lymphoblastic leukemia (ALL) (P=0.0013 for Tg(rag2:MYC-ER;lck:EGFP) [MYC-ER;green line] vs. Tg(rag2:MYC- ER;lck:EGFP;lck:CK2αwt; rag2:mCherry); [MYC-ER;CK2αwt; red line] n=19 and n=22, respectively; and P=0.0008 for MYC-ER;CK2αwt [red line] vs.Tg(rag2:MYC- ER;lck:EGFP;lck:CK2αK68M;rag2:mCherry) [MYC-ER;CK2αK68M; black line], n=22 and n=13, respectively). There was no statistical significance between MYC- ER and MYC-ER;CK2αK68M fish. Statistical analysis was performed using the log-rank test. The scale bar in the left and middle panel of Figure 1B =1 mm and in the right panel =200 mm.
1462
haematologica | 2021; 106(5)
