
Page 165 - 2021_05-Haematologica-web
P. 165
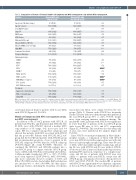
Mantle cell lymphoma with MYC-R
Table 2. Comparision of features of blastoid mantle cell lymphoma wih MYC rearrangement and without MYC rearrangement.
Features
Blastoid MCL with MYC-R (n=24)
63 (47-82)
71% (17/24) 17:7 91% (20/22) 86% (18/21) 40% (4/10) 80% (16/20) 68% (15/22) 40% (8/20) 57% (12/21) 24% (5/21) 100% (16/16)
73% (8/11) 33% (4/12) 78% (18/23) 39% (9/23) 50% (4/8) 86% (12/14) 80% (12/15) 69% (9/13) 75% (12/16) 90 (15-100)
68% (15/22)
32% (7/22)
55% (12/22)
Blastoid MCL with P Non- MYC-R (n=29)
67 (33-85) 0.96
62% (18/29) 0.76 20:7 0.75 89% (24/27) 1.00 74% (20/27) 0.72 29% (4/14) 0.67 88% (22/25) 0.61 62% (13/21) 0.99 30% (6/20) 0.74 53% (9/17) 1.00 7.4% (2/27) 0.22 100% (12/12) 1.00
88% (15/17) 0.28 33% (7/21) 1.00 81% (22/27) 0.72
Age(years), Median (range)
Age ≥60 (years)
Sex (Male:Female)
Stage IV
BM-Positve
CNS-Positve
Extranodal Sites ≥2
Elevated LDH (>618 U/L) Elevated WBC (>11.0×10⁶/mL) High MIPI
Leukemic Non-Nodal Complex Karyotype Immunophenotype
SOX11+
BCL6+
CD5+
CD10+
MUM-1+ BCL2+(≥50%)
MYC+ (≥40%) MYC/BCL2 co-express P53+ (≥20%)
Ki67, Median (range)
Treatment
Aggressive chemotherapy
Other chemotherapy
Initial CR
12% (3/25)
71% (5/7) 0.59
95% (19/20) 0.54
20% (4/20)
16% (3/19)
69% (9/13) 0.97 90 (30-100) 0.37
38% (10/26) 0.08
62% (16/26) 0.15
70% (16/23) 0.34
0.046*
0.001* 0.004*
BM: bone marrow; CNS: central nervous system; CR: complete remission; LDH: lactate dehydrogenase; MYC-R: MYC rearrangement; N: number of cases; MIPI: Mantle Cell Lymphoma International Prognostic Index; aggressive chemotherapy (R-CHOP): rituximab, cyclophosphamide, doxorubicin, vincristine, prednisone; other chemotherapy (R-Hyper-CVAD):rituximab,cyclophosphamide,vincristine,doxorubicin,dexamethasone; SCT:stemcelltransplant;WBC:whitebloodcell;*P<0.05
sion/transformation than for patients with de novo MCL with MYC-R (Figure 2A, P=0.019).
Mantle cell lymphoma with MYC rearrangement versus non-MYC rearrangement
In addition to the 27 MCL patients with MYC-R, 21 patients had MYC-EC, and 40 patients had MYC-NL. The 21 MCL cases with MYC-EC showed a median MYC copy number of 3.5 (range, 3-6); most cases had 3-4 copies. OS was compared among these subgroups and showed that patients with MCL associated with MYC-R had the poorest OS. Patients with MYC-NL MCL sub- group had the best OS and patients with MYC-EC group had an intermediate prognosis, closer to patients in the MYC-NL subgroup (P=0.34) than the MYC-R subgroup (P=0.074) (Figure 2B, overall P=0.0007). Therefore, we combined the MYC-EC and MYC-NL patients into a non-MYC-R group to compare with the MYC-R group. Cases of MCL with MYC-R more frequently showed blas- toid/pleomorphic morphology (89% vs. 54%, P=0.004), more often expressed CD10 (P=0.01), MYC (P=0.0001), and, more commonly showed coexpress of MYC and BCL-2 (P=0.0001) and also had a higher Ki67 proliferation rate (median 90% vs. 60%) (P<0.004). All other clinico- pathologic features, including the frequency of leukemic
non-nodal form MCL, were similar between the two groups (Table 1). Patients with MYC-R less frequently reached CR after induction chemotherapy than patients in the non-MYC-R group (33% vs. 62%, P=0.03), despite more often receiving intensive induction therapy. The median OS of MCL patients with MYC-R was significant- ly lower than that of patients in the non-MYC-R group with 3-year OS rates of 33% and 67%, respectively (Figure 2C, P=0.0002). This result was also true when only de novo cases were included in the analysis (Figure 2D, P=0.030).
Since MYC-R occurred predominantly in blastoid/pleo- morphic variants, a comparison of MCL with MYC-R versus non-MYC-R was further explored in cases with only blastoid or pleomorphic morphology. There were 53 cases of MCL with blastoid/pleomorphic morphology, includ- ing 24 cases with MYC-R and 29 cases without MYC-R. As shown in Table 2, almost all clinicopathologic features, including P53 expression, frequency of a complex kary- otype, and CR rate of patients with MYC-R were very similar to patients with non-MYC-R, except that the MYC-R group of neoplasms were more often positive for MYC and CD10 (P<0.05). The median OS of patients with MYC-R was significantly worse than that of patients in the non-MYC-R subgroup when all blastoid/pleumor-
haematologica | 2021; 106(5)
1385
