
Page 156 - 2021_05-Haematologica-web
P. 156
A. Bornert et al.
and b5 tubulin isotypes,33 we pharmacologically depoly- merized microtubules within preformed nPPT. Microtubule depolymerization was induced during the course of nPPT elongation by injecting the microtubule- destabilizing drug vincristine into WT mice (1 mg/kg). At this dose, vincristine induces depolymerization of micro- tubules from the marginal band of circulating platelets and from marrow cells in the extravascular compartment (Online Supplementary Figure S4; Online Supplementary Figure S5). Time-lapse recordings showed that the majori- ty of preformed nPPT underwent shrinkage within 10 minutes after vincristine administration as illustrated in Figure 5A and Online Supplementary Video S4, and quanti- fied in Figure 5B-D. Most nPPT progressively became
shorter (Figure 5A-C) and increased their thickness, espe- cially at their base (Figure 5D). In some cases, the shrank fragments were captured on time-lapse recordings while they were released into circulation. Doubling the vin- cristine dose (2 mg/kg) accelerated PPT shrinkage to as early as 2 minutes after drug administration (Figure 5E). These results indicate that the microtubule cytoskeleton is required to maintain the nPPT elongated morphology once it is formed.
Microtubules are dispensable for Myh9-/- proplatelet elongation
Given that myosin IIA is required for the retraction phases observed in WT nPPT, we investigated whether
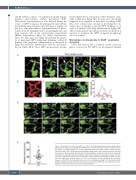
A
BC
D
E
Figure 7. Proplatelets are under the influence of blood flow. (A) Z-projection time-lapse images show- ing relaxation of three native proplatelets (nPPT) after cessation of blood flow due to cardiac arrest of the mouse, revealing the presence of three nPPT (indicated by the white, yellow and blue arrows). Observed in three mice. (B) Z-projection showing the anastomosis of the sinusoid vessels in the skull bone marrow. Arrows indicate the flow direction illustrating the complexity of the flows in sinusoids. (C) Detail of a sinusoid bifurcation leading to inverse flows (opposed red and blue arrows). The flow velocity in each portion of the vessel as a function of time is plotted on the graph (red line, left side; blue line, right side), showing phases of stasis, accelerations and decelerations. (D) Time-lapse images of an nPPT in the same bifurcation as in (C), oscillating according to the flow direction. (E) Graph showing the platelet velocities measured in vessels where nPPT were recorded (mean ± stan- dard error of the mean, nine mice). Note the large variations.
1376
haematologica | 2021; 106(5)
