
Page 81 - 2021_04-Haematologica-web
P. 81
A new promising CAR.CD30 T-cell therapy for CD30+ lymphoma.
A
B
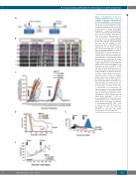
Figure 7. Re-challenge of the non- Hodgkin lymphoma mouse model to evaluate long-term anti-lymphoma activity of CAR.CD30 T cells in generat- ing an efficient immunological memo- ry. (A) The schema shows the in vivo xenograft immunodeficient re-challenge mouse model, in which non-Hodgkin lymphoma Karpas-299-eGFP-FFLuc cells were systemically infused into NSG mice, at day -3 and day +140. Effector cells were infused intravenously only once, at the time of tumor establish- ment (day 0) assessed by IVIS imaging. Blood was collected periodically from the mice. (B) IVIS imaging of tumor growth from day 0 to day +240 (end of experiment). At day +140, surviving mice treated with CAR.CD30 T cells (2 mice treated with 28-41BBζ and 4 mice with 28.OX40ζ T cells) received the sec- ond intravenous infusion of tumor. As a control, six mice were given only Karpas- 299-eGFP-FFLuc cells (CTR Mice). Days from the tumor re-challenge are shown in blue. (C) Bioluminescence of each single xenograft mouse treated with NT (black lines; 8 mice); 28.4-1BBζ T cells (red lines; 10 mice); 28.OX40ζ T cells (blue line; 10 mice). Bioluminescence in the control cohort of the tumor re-chal- lenge (CTR Mice) is shown by black dot- ted lines. Tumor infusions are repre- sented by black arrows. (D) Kaplan- Meier survival curve analysis of tumor- bearing mice treated with non-trans- duced (NT, black line), 28.4-1BBζ (red line), 28.OX40ζ (blue line). Overall sur- vival of control mice is shown by a dot- ted black line. *P<0.05; **P<0.001; ***P<0.0001; ****P<0.00001. (E) Three-dimensional area graph showing the percentage of circulating human CD3+ T cells during long-term in vivo experiments of mice treated with NT (black area), 28.4-1BBζ T cells (red area) and 28.OX40ζ T cells (blue area). Tumor infusions are represented by black arrows. (F) Average percentages of circulating human CD3+/CAR+ T cells in mice treated with NT (black line), 28.4-1BBζ T cells (red line) and 28.OX40ζ T cells (blue line). Black arrows represent tumor infusions.
C
DE
F
haematologica | 2021; 106(4)
997
