
Page 80 - 2021_04-Haematologica-web
P. 80
M. Guercio et al.
Discussion
To date, clinical trials conducted in adults with relapsed/refractory CD30+ lymphoma, using II- CAR.CD30 T cells, led to suboptimal outcomes.21,22 As in patients with B-cell acute lymphocytic leukemia receiving CAR.CD19 T cells,29 a clear correlation between CAR T-
A
B
cell persistence in peripheral blood and clinical benefit was reported in HL and NHL,21,30 highlighting the need for fur- ther optimization. We, therefore, attempted to include a novel scFv, derived from the high-affinity anti-CD30 mouse AC10 monoclonal antibody, in our CAR con- struct.25 In the context of high-affinity CAR, major con- cerns are related to CAR T-cell overstimulation, induction
C
D
EF
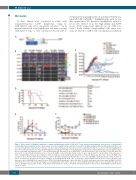
Figure 6. Mouse model of Hodgkin lymphoma to evaluate anti-lymphoma activity of CAR.CD30 T cells generated and expanded in the presence of interleukin-2 or interleukin-7/interleukin-15. (A) The schema shows the in vivo xenograft immunodeficient mouse model, in which Hodgkin lymphoma (HL) L428-eGFP-FFLuc cells were systemically infused into NSG mice. Effector cells were infused intravenously at the time of tumor establishment (day +6), as assessed by IVIS imaging. Blood was collected periodically from the mice. (B) IVIS imaging of tumor growth from day +6 to day +165 (end of experiment). (C) Bioluminescence of each single xenograft mouse treated with non-transduced (NT) T cells and interleukin (IL)2 (black line; 5 mice); 28.4-1BBζ T cells (IL2) (red line; 5 mice); 28.OX40ζ T cells (IL2) (blue line; 5 mice); NT T cells (IL7/IL15) (dotted black line; 5 mice); 28.4-1BBζ T cells (IL7/IL15) (dotted red line; 5 mice) and 28.OX40ζ T cells (IL7/IL15) (dotted blue line; 5 mice). (D) Kaplan-Meier survival curve analysis of tumor-bearing mice treated with NT (IL2) (black line; 5 mice), 28-OX40ζ (IL2) (blue line; 5 mice), 28-41BBζ (IL2) (red line; 5 mice), NT (IL7/IL15) (dotted black line; 5 mice), 28-OX40ζ (IL7/IL15) (dotted blue line; 5 mice) and 28-41BBζ (IL7/IL15) (dotted red line; 5 mice). P- values are reported in the table. (E) Average percentages of circulating human CD45+ CD3+ T cells in mice treated with NT (IL2) (black line; 5 mice), 28-OX40ζ (IL2) (blue line; 5 mice), 28-41BBζ (IL2) (red line; 5 mice), NT (IL7/IL15) (dotted black line; 5 mice), 28-OX40ζ (IL7/IL15) (dotted blue line; 5 mice) and 28-41BBζ (IL7/Il15) (dotted red line; 5 mice). (F) Average percentages of circulating human CD3+ CAR+ T cells in mice treated with NT (IL2) (black line; 5 mice), 28-OX40ζ (IL2) (blue line; 5 mice), 28-41BBζ (IL2) (red line; 5 mice), NT (IL7/IL15) (dotted black line; 5 mice), 28-OX40ζ (IL7/IL15) (dotted blue line; 5 mice) and 28-41BBζ (IL7/Il15) (dotted red line; 5 mice).
996
haematologica | 2021; 106(4)
