
Page 77 - 2021_04-Haematologica-web
P. 77
A new promising CAR.CD30 T-cell therapy for CD30+ lymphoma.
A
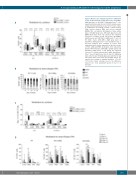
Figure 4. Memory and exhaustion profiles in CAR.CD30 T cells. (A) Non-transduced (NT; white bars), 28.4.1BB.ζ (light gray bars) or 28.OX40.ζ (dark gray bars) T cells, expanded in interleukin (IL)2 or IL7/IL15 cytokines were analyzed by flow-cytometry at day +15 of in vitro culture to establish the percentage of naïve, central memory (CM), effector memory (EM) and effector terminal (EMRA) CD3+ cell subsets. (B) Analysis of naïve (white bars), CM (light gray bars), EM (dark gray bars) and EMRA (black bars) CD3+ cell subsets in the long-term “stressed” co-culture for NT (left panel), 28.4-1BB.ζ (middle panel) and 28.OX40.ζ (right panel) T cells. (C) NT (white bars), 28.4.1BB.ζ (light gray bars) or 28.OX40.ζ (dark gray bars) T cells expanded in IL2 or IL7/IL15 cytokines were analyzed to assess their exhaustion profile by the expression of the three mark- ers PD1, LAG3 and TIM3. (D) Analysis of the exhaustion profile in NT (left panel), 28.4.1BB.ζ (middle panel) and 28.OX40.ζ (right panel) T cells during the long-term “stressed” co-culture assay at day 0 (white dotted bars), Time I: day +5 (white bars), time II: day +10 (light gray bars), time III: day +15 (dark gray bars) and time IV: day +20 (black bars). Data from four healthy donors are expressed as average ± standard deviation. *P<0.05; **P<0.001. Circled asterisks refer to the difference between the T-cell population grown in IL2 or in IL7/IL15.
B
C
D
haematologica | 2021; 106(4)
993
