
Page 76 - 2021_04-Haematologica-web
P. 76
M. Guercio et al.
AB
C
D
EF
GH
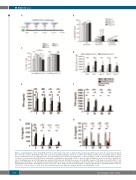
Figure 3. Long-term tumor control and CAR.CD30 T-cell selection in the “stressed” co-culture in vitro assay model. (A) The panel shows the experimental design of the “stressed” co-culture. (B) Residual CD30+ tumor cells were quantified during the “stressed” co-culture after addition of tumor cells every 5 days. Data are shown for day +5 (white bars), day +10 (light gray bars), day +15 (dark gray bars) and day +20 (black bars). (C) The percentage of CAR+ T cells was quantified during the “stressed” co-culture. Data are shown for day 0 (dotted bars, referring to the percentage of CAR+ T cells before the first addition of tumor cells), day +5 (white bars), day +10 (light gray bars), day +15 (dark gray bars) and day +20 (black bars). (D) Mean fluorescence intensity (MFI) analysis of CAR expression on 28.4-1BB.ζ T cells (gray bars) and 28.OX40.ζ T cells (black bars). (E) Interferon (IFN)-γ, (F) tumor necrosis factor (TNF)-α, (G) interleukin (IL)-2 and (H) IL-10 production was analyzed in supernatants collected 24 h after addition of tumor cells to the culture. Data from seven healthy donors are expressed as average ± standard deviation. *P≤0.05; **P≤0.01; ***P≤0.001 and ****P≤0.0001. Circled asterisks refer to the difference between 28.OX40.ζ and 28.4-1BB.ζ T cells.
992
haematologica | 2021; 106(4)
