
Page 254 - 2021_04-Haematologica-web
P. 254
Letters to the Editor
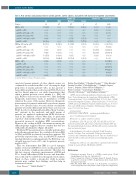
Table 2. Red cell mass and plasma volume in anemic patients, control subjects, and patients with increased hemoglobin concentration.
Anemic (%) Moderate
27
7 (25.9)
andPV<-25% 0(0)
andPV≥-25%and<-8% 0(0)
andPV≥-8%and≤+8% 0(0)
andPV>+8%and≤+25% 3(4.8)
andPV>+25% 12(19.0)
RCM ≥ -25% and ≤ +25% 46 (73.0)
andPV<-25% 0(0) 0(0) 0(0) 0(0) 0(0) 75(4.1) andPV≥-25%and<-8% 1(1.6) 1(3.7) 0(0) 0(0) 35(36.1) 614(33.8) andPV≥-8%and≤+8% 3(4.8) 3(11.1) 0(0) 0(0) 52(53.6) 297(16.4) and PV > +8% and ≤ +25% 10 (15.9) 9 (33.3) 1 (3.7) 0 (0) 9 (9.3) 16 (0.9) and PV > +25% 32 (50.8) 12 (44.4) 19 (70.4) 1 (11.1) 0 (0) 2 (0.1)
All
Total, n 63
RCM < -25% 15 (23.8)
Mild
27
0 (0)
Severe
9
8 (88.9)
Control (%)
97
1 (1.0)
Polycythemic (%)
1,815
3 (0.2)
0(0)
0(0)
0(0)
0(0)
0(0) 5(18.5) 7(77.8) 0(0) 0(0)
0(0) 0(0) 1(1.0) 1(0.1) 0(0) 0(0) 0(0) 2(0.1) 0(0) 0(0) 0(0) 0(0)
2(7.4) 1(11.1) 0(0) 0(0)
25 (92.6) 20 (74.1) 1 (11.1) 96 (99.0) 1,004 (55.3)
RCM>+25% 2(3.2) 2(7.4) 0(0) 0(0) - 808(44.5)
andPV<-25% 0(0) 0(0) 0(0) 0(0) - 13(0.7)
andPV≥-25%and<-8% 0(0) 0(0) 0(0) 0(0) - 283(15.6)
andPV≥-8%and≤+8% 0(0) 0(0) 0(0) 0(0) - 414(22.8)
andPV>+8%and≤+25% 0(0) 0(0) 0(0) 0(0) - 83(4.6)
andPV>+25% 2(3.2) 2(7.4) 0(0) 0(0) - 15(0.8) n: number; RCM: red cell mass; PV: plasma volume.
unselected anemic patients of other clinical centers, we
3
confirmed the results from Otto et al. showing the high proportion of anemic patients who, in fact, present a hemodilution rather than a reduction in RCM. However, and for clinical purposes, our study demonstrates that when a patient presents severe anemia (i.e., [Hb] <80 g/L), RCM is decreased in around 90%, thus justifying therapeutic intervention (such as transfusion or ESA) whatever the cause of the anemia. However, therapeutic interventions for patients with mild or moderate anemia have to be discussed since we noticed that over half the patients were hemodiluted and did not have a decrease in RCM. In order to distinguish hemodiluted from “real ane- mic” patients in the moderate and mild groups of patients, we analyzed erythropoietin (EPO) level meas- ured in the different cohorts. Our data, as previously reported,6 demonstrated that only truly anemic patients presented increased circulating EPO concentrations. However, the overlap in EPO concentrations among the different groups suggested that as a marker this was not sufficiently discriminative (Figure 2E and F).
6 Nathalie Parquet,
RCM and PV measurement are currently performed for polycythemic patients since the correlation between [Hb] or [Hct] and RCM is relatively low in these patients. We previously reported that, even in JAK2V617F mutated myeloproliferative neoplasm patients, the RCM was con- sistently increased over +25% only for patients present- ing Hct >55%.7
Here we demonstrate that [Hb] is a good surrogate marker of decreased RCM for severe anemic patients but not for moderate or mild anemic patients. Therefore, for this last category of patients, measurement of RCM and PV to clearly differentiate RCM decrease and hemodilu- tion could only be useful before therapeutic intervention. Based on these results, a prospective study in anemic patients may confirm these findings and thus help in treatment decisions.
Louis Drevon,1,2,3 Nabih Maslah,1,2,3
5 1,2,3 Laetitia Vercellino, Ceĺia Belkhodja,
Juliette Soret-Dulphy,2,4 Christine Dosquet,1,2,3 Odno Ravdan,1
6
Anne C. Brignier, Marie-Heĺeǹ e Schlageter,
Bruno Cassinat,1,2,3 Jean-Jacques Kiladjian,2,3,4 Christine Chomienne1,2,3and Stéphane Giraudier1,2,3
Paris; FranceIntergroupedesSyndromesMyeĺoprolifeŕatifs(FIM); 3Université de Paris, U1131 INSERM, IRSL, F-75010 Paris; 4APHP, Centre d’Investigations Cliniques, Hôpital Saint-Louis, F-75010 Paris; 5APHP, Service de Médecine Nucléaire, Hôpital Saint-Louis, F-75010 Paris and 6APHP, Service d’Aphérèse Thérapeutique, Hôpital Saint- Louis, F-75010 Paris, France
Correspondence:
STEPHANE GIRAUDIER - stephane.giraudier@aphp.fr
doi:10.3324/haematol.2020.249409
Disclosures: no conflicts of interest to disclose.
Contributions: LD, OR, JS, CC, CD, NP, AB, JJK and SG fol- lowed the patients; LD, CB and SG collected data; MHS, NM and BC performed biological analysis; LD, BC, JJK and SG analyzed the data and wrote the paper.
Acknowledgments: the authors particularly thank Veronique Lenoble, Veronique Tran and Armelle Yollant for their technical assistance and commitment during this work. They also thank the local tumor biobank of Saint Louis Hospital for providing high quality samples.
Funding: this work was also supported by a grant from the National Institute of Cancer (INCa, TRANSLA CTIM3).
References
1.Nutritional anaemias. Report of a WHO scientific group. World Health Organ Tech Rep Ser. 1968;405:5-37.
2. Takei T, Amin NA, Schmid G, Dhingra-Kumar N, Rugg D. Progress in global blood safety for HIV. J Acquir Immune Defic Syndr. 2009; 52 Suppl 2:S127-S131.
3. Otto JM, Plumb JOM, Clissold E, et al. Hemoglobin concentration, total hemoglobin mass and plasma volume in patients: implications
1APHP, Service de Biologie Cellulaire, Hôpital Saint-Louis, F-75010 2
1,2,3
1170
haematologica | 2021; 106(4)
