
Page 252 - 2021_04-Haematologica-web
P. 252
1168
Letters to the Editor
AB
CD
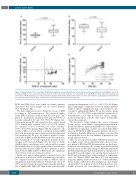
Figure 1. Plasma volume (PV), red cell mass (RCM) and hemoglobin concentration [Hb] in control subjects and anemic patients. Box-and-Whisker plot of (A) PV and (B) RCM (in % of expected theoretical value) in control and anemic patients. (C) Correlations of PV and RCM in control and anemic patients. (D) Correlations of RCM and [Hb] (g/L) in control and anemic patients. Black points and discontinued line represent control patients, gray triangles and discontinued line represent anemic patients, black continuous line represents both anemic and control patients.
RCM and [Hb] level was found in anemic patients (P<0.0001) but, interestingly, not in control patients (P=0.12) (Figure 1D).
We then analyzed in more detail the levels of [Hb] according to PV measurements. We observed higher mean [Hb] in patients with normal PV (156 g/L) com- pared to moderately expanded (126 g/L; P<0.0001) or severely expanded (99 g/L; P<0.0001) PV (Figure 2A). Conversely, mean PV was lower for the control group (-5%) than in mild “anemia” (+26%; P<0.0001), moder- ate “anemia” (+49%; P<0.0001) or severe “anemia” (+60%; P=0.0001) groups (Figure 2B). In contrast to the results of Otto et al.3, in which correlation between [Hb] and total hemoglobin mass (measured with respiratory test) weakened as PV rose, we found a positive correla- tion between [Hb] and RCM whatever the PV status (nor- mal, moderately or severely expanded), and this did not weaken as PV increased (Figure 2C). In order to define whether these correlations were only found for anemic and normal subjects, we also analyzed the correlation for patients with increased [Hb]. For those patients, correla- tions between [Hb] and PV or RCM were also significant (P<0.0001 in both cases) (data not shown).
Lastly, since spleen enlargement is considered to be the main cause of an increase in PV in hematologic disorders, we compared anemic patients with or without spleen enlargement and normal subjects. Twenty-nine out of 63 (46%) anemic patients presented splenomegaly and these had a significantly higher PV than anemic patients with-
out spleen enlargement (+49% vs. +34%; P=0.03) (Figure 2D). Surprisingly, comparison between anemic patients without spleen enlargement and control patients also revealed a significantly higher PV in the anemic group (+34% vs. -5%; P<0.0001), suggesting that anemia due to hemodilution is not only associated to spleen enlarge- ment and that there could be other causes of hemodilu- tion in these patients.
We decided to verify whether the causes of anemia (heart disease, renal failure, hypergammaglobulinemia, portal thrombosis, primary myelofibrosis, other myelo- proliferative neoplasms) could be associated with differ- ences in PV, RCM or [Hb] in anemic patients. However, we failed to find any difference according to disease; this was probably due to the low number of patients in each group (data not shown).
Here we retrospectively analyzed RCM measurements in a single center cohort of patients with a focus on ane- mic patients. RCM and PV determinations are rarely per- formed in these patients. We assume a study bias in this patient cohort as clinicians asking for RCM measurement probably hypothesize that their patients would present a hemodilution rather than a true anemia. Measurement of RCM was performed here using standard recommenda- tions (Cr51-labeled RBC) and direct PV was measured using the dilution method based on I125-labeled albumin. Then, using a different technical approach, and despite the probable bias in patient selection that may have arti- ficially increased the hemodilution rate compared to
haematologica | 2021; 106(4)
