
Page 248 - 2021_04-Haematologica-web
P. 248
Letters to the Editor
AB
CD
EF
GH
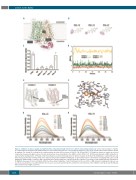
Figure 1. Inhibition of glucose uptake via GLUT1 by PGL compounds through interference with the intracellular domain. (A) Cartoon representation of GLUT1 in complex with cytochalasin B (CB) (PDB ID 5EQI). N- and C-terminal domains are colored in wheat and green, respectively, and the intracellular domain is shown in magenta. The bound CB is shown in stick representation in yellow. (B) Structures of PGL-13, PGL-14 and PGL-27. (C) Inhibition of glucose uptake by selected compounds measured in giant vesicles. Results demonstrate mean normalized to the DMSO control (CTRL), n=5. (D) Molecular dynamics (MD) simulation of representative binding modes of PGL-14 at GLUT1 (complex 1-3) and at homology model of GLUT1 (complex 4). (E) Two PGL binding sites, transmembrane and intracellular, predicted by docking of PGL-14. Complex 2 with predicted inhibitor binding site at GLUT1 inward open conformation overlapping with a glucose/CB binding site (PDB ID 5EQI). Complex 4 with a predicted intracellular binding site at homology model of GLUT1 in a partially occluded inward-facing conformation. (F) Minimized average structure of PGL-14 within the intracellular binding site of GLUT1, derived from the last 15 ns of MD simulation. Hydrogen bonds are rep- resented as dashed lines. (G and H) Intrinsic fluorescence spectra for purified GLUT1 at different concentrations of the inhibitors (G) PGL-13 and (H) PGL-14, with excitation wavelength at 295 nm.
1164
haematologica | 2021; 106(4)
