
Page 114 - 2021_04-Haematologica-web
P. 114
L. Lee et al.
D
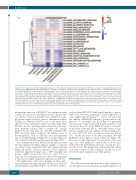
Figure 5. Gene expression. (A) Differentially expressed genes. Three different primary blasts from relapsed FLT3-ITD acute myeloid leukemia (AML) patients were treated with 50 nM quizartinib, 250 nM PLX51107, a continuous combination of both (50 nM quizartinib and 250 nM PLX51107), or intermittent dosing (6 hours [h]) of 250 nM PLX51107 and continuous 50 nM quizartinib. Cells were collected at both 6-h and 24-h time points for the transcriptome analysis. In each condition, the number of differentially expressed genes (averaged for the three samples) with false discovery rate (FDR) values <0.05 is shown. (B) Average expression of MYC for the three samples in (A) for each treatment condition compared to its time-matched baseline control. logFC values from the baseline are shown. (C) Heat map representation of the Ingenuity Pathway Analysis using the differentially expressed genes in each condition. Genes detected in (A) were used as input data. From the generated upstream factors, those that are not a single gene or miRNA were excluded. Upstream factors that had the highest activation z-scores in absolute value >4.5 were extracted. The color on the heat map indicates the activation z-scores and the heat map data are clustered by row. (D) Camera gene set enrichment analy- sis was performed on the three AML samples using MSigDB Hallmark gene sets. From the hallmark gene sets, those with -log10 (FDR) scores >2 were analyzed. Downregulated gene sets are indicated by negative values. Red: upregulated; blue: downregulated.
intermittent) exposure to PLX51107 in combination with continuous exposure to quizartinib yielded a pattern that was similar to that of quizartinib alone. Using both a sim- ple iterative approach and a gene set enrichment analysis (GSEA), we identified MYC as one of the genes most affected by the combination of the two drugs (Figure 5B). We then used the upstream analysis function in the inge- nuity pathway analysis (IPA) to analyze the changes induced by the drug exposure. The IPA confirmed that MYC-associated genes displayed the highest level of downregulation, even in cells that were intermittently exposed to BET inhibition (Figure 5C). Camera GSEA was also consistent with IPA upstream analysis (Figure 5D).
We confirmed that MYC RNA levels and protein were directly suppressed in these primary samples co-cultured on stroma using quantitative-PCR and immunoblotting (Figure 6A and B). Six-hour exposure to BET inhibition resulted in augmented suppression of MYC transcript and protein, which resolved by 24 h (i.e., after 18 h of washout). The synergistic cytotoxic effects were apparent- ly the result of suppressing MYC expression for just 6 h.
The implications of the above findings are that combi- nation therapy with approximately 120 mg/day PLX51107 and 60 mg/day quizartinib will be a more effective thera-
py for relapsed FLT3-ITD AML than 60 mg/day of quizar- tinib alone. However, quizartinib is myelosuppressive at doses higher than 60 mg/day23,26,27 and it is possible that the addition of PLX51107 will lead to greater marrow sup- pression. To investigate this possibility, we performed colony assays using normal BM-derived progenitor cells exposed to these two drugs. PLX51107 alone at concentra- tions below 1,000 nM had no discernible effect on ery- throid or granulocyte-macrophage colony forming activi- ty, even with 10-14 days of continuous exposure (Figure 7A). In the presence of 50 nM quizartinib, 500 nM PLX51107 did suppress colony formation (Figure 7B). However, in this experiment, the progenitor cells were exposed to BET inhibition continuously for 10-14 days, rather than the intermittent exposures used in the cyto- toxicity assays. We predict that intermittent BET inhibi- tion with continuous FLT3 inhibition would not cause intolerable myelosuppression in AML patients.
Discussion
The BM microenvironment protects blasts against tox- ins through diverse mechanisms, including expression of
1030
haematologica | 2021; 106(4)
