
Page 111 - 2021_04-Haematologica-web
P. 111
BET and FLT3 inhibition for FLT3-ITD AML
We repeated the combination treatments using three different primary AML samples on stroma and analyzed gene expression patterns at different time points using RNA sequencing. Using a false discovery rate (FDR) cut- off of 0.05 in transcript level, global changes in gene
expression were minimal with quizartinib at 6 h and modest at 24 h (Figure 5A). Not surprisingly, the addition of PLX51107 resulted in more dramatic changes in gene expression at both 6 h and 24 h. The effects of BET inhi- bition on gene expression were transient, as a 6-h (e.g.,
A
B
C
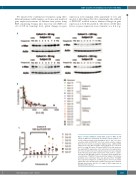
Figure 3. Plasma inhibitory activity (PIA) assays for MYC. (A) PIA assays for MYC were performed on patients' plasma samples col- lected at different time points throughout cycle 1 day 1 in a dose escalation study of PLX51107. Out of six cohorts, only the samples from the four cohorts receiving the highest doses exhibited MYC suppression in the MYC surrogate assay (shown here). Cohorts 5 and 6, receiving 120 mg or 160 mg of PLX51107 per day, produced the maximal MYC suppressive effect, which lasted for approximate- ly 6 hours (h). (B) A total of 17 patients’ plasma sets were analyzed by the PIA assay. Each symbol represents a time point for a partic- ular patient. The MYC PIA result for each point is plotted against the concentration of PLX51107 measured in that sample. The plasma standard curve (solid black line) was generated from OCI-AML3 dose responses in Figure 1A. (C) PIA assays for cohort 5 are plotted against time after dosing. Values for MYC expression were obtained through densitometry and the 6-h length of MYC suppression is indicated by the bracket.
haematologica | 2021; 106(4)
1027
