
Page 110 - 2021_04-Haematologica-web
P. 110
L. Lee et al.
trol (Figure 4B). There was inter-sample variation in the cytotoxic response to quizartinib (consistent with that previously observed; see Figure 4A), while PLX51107 by itself induced minimal cytotoxicity. The drugs induced no apparent effect on the proliferation of the stromal cells, either alone or in combination (data not shown). Importantly, the combination of the two drugs resulted in a synergistic cytotoxic effect against the patient-derived blasts (Figure 4B). We used ten samples in this fashion (the clinical data for these ten patients are detailed in Online Supplementary Table S1) and averaged the responses in an MTT assay to demonstrate a consistent synergy by medi- an effect analysis (Figure 4C). We confirmed these results by performing direct cell counts using Trypan Blue exclu- sion to identify viable cells (data not shown). However, this synergistic effect was the result of continuous exposure to
BET inhibition. The PIA data (see Figure 3) indicated that BET inhibition only lasted for approximately 6 h per day in patients. Therefore, we modeled this intermittent BET inhibition by incubating the blasts with PLX51107 for 6 h per day during the 3-day exposure period, with quizar- tinib continuously present (Figure 4D). Interestingly, the degree of cytotoxicity with intermittent exposure to BET inhibition was similar to that observed with continuous exposure. The explanation for this may be that the effects of PLX51107 on transcription persist for several hours after exposure to the drug, at least as seen in the mouse xenograft studies (Figure 1) and as observed by others.20 We repeated the combination experiment using a different FLT3 inhibitor, gilteritinib, to confirm that the synergy was due to a FLT3 TKI class effect (Online Supplementary Figure S3).
AB
C
1026
haematologica | 2021; 106(4)
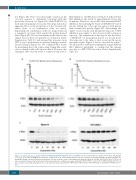
Figure 2. In vitro and in vivo correlative analysis of PLX51107 pharmacodynamic effect. OCI-AML3 cells were treated with increasing concentrations of PLX51107 for 3 hours (h) in either (A) RPMI/10% fetal bovine serum media or (B) control human plasma. Cells were then lysed and probed for MYC by immunoblotting. The quantitative analyses were performed by densitometry. The dose response curves in the graphs were generated from the average densitometry values of three sep- arate experiments. Representative blots from both media and plasma conditions are shown. (C) Molm14 (FLT-ITD FLT3 receptor) and OCI-AML3 (wild-type FLT3 recep- tor) cells were treated with quizartinib for 3 h. Cells were then lysed and analyzed for MYC protein expression by immunoblotting, as described in the Methods sec- tion.
