
Page 96 - 2021_03-Haematologica-web
P. 96
M.A. Bauer et al.
AB
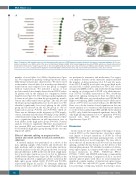
Figure 5. Analysis of differentially expressed and alternatively spliced genes in SF3B1 mutated samples identified enrichment in important pathways. (A) The nor- malized enrichment score (NES) results of the Gene Set Enrichment Analysis (GSEA). (B) A network diagram produced by STRING, which uses known and predicted protein-protein interactions. Using the genes that are the most significantly alternatively spliced by JunctionSeq or DEXSeq and setting the minimum required inter- action score of 0.9, the resulting network diagram is shown with highly confident interactions. Sub clusters with fewer than three nodes were removed.
number of novel splice loci (Online Supplementary Figure S4). We compared the makeup of the groups based on key MM clinical and genomic characteristics. We first looked at the number of novel splice loci in each group defined by translocations and compared it to the group of samples without translocations. We included a group of four pooled normal donor samples derived from CD138 select- ed plasma cells in the analysis for comparison (Online Supplementary Figure S5). The t(4;14) group had significant- ly fewer novel splice loci than the group with no translo- cations and other translocation groups. The t(11;14) and t(6;14) group had significantly more novel splice loci. We identified significantly less novel splicing in the t(4;14) group and an increase in the t(11;14) group (vs. the no translocation group; P=0.002 and P=0.0001) (Table 2). There was no difference in the frequency of MYC translo- cations, International Myeloma Working Group (IMWG) or International Scoring System (ISS) risk scores but there was a significant difference in p53 inactivation (one or both alleles) in the high splice group (P=0.019). Survival analysis revealed a significant difference in progression- free survival (PFS) and overall survival (OS) (P=0.03 and 0.013) with the high splice group having adverse outcome (Figure 6A and B).
Effect of aberrant splicing on progression-free survival and overall survival in t(11;14) and t(4;14) subgroups
A survival analysis was performed on a subset of the data, splitting samples with t(11;14) and t(4;14) into the high, medium, and low number of novel splice junctions. Survival analysis for the t(11;14) group showed a non-sig- nificant difference in PFS in the t(11;14) with a high num- ber of novel splice junctions versus low, but no difference in OS (Online Supplementary Figure S6). OS and PFS for the t(4;14) group showed a significant adverse survival in the high splice group within t(4;14) (P=0.009 and P<0.001, respectively) (Figure 6C and D). To determine additional features that may contribute to this ultra high-risk group,
we performed a univariate and multivariate Cox regres- sion analysis. Features in the univariate analysis included the number of driver mutations (0-4, 5-9 and 10+ muta- tions), ISS (I, II and III), novel splice site group (high, medi- um and low), bi-allelic inactivation of TP53, loss of het- erozygosity (LOH) (>4.6%), and double-hit (being defined as amp1q on a background of ISS III or bi-allelic inactiva- tion of TP53).34 Bi-allelic inactivation of TP53, double-hit, high novel splicing, having more than ten driver muta- tions, and LOH were associated with poorer PFS (P≤0.05). High novel splicing, LOH, double-hit and bi-allelic inacti- vation of TP53 were associated with poorer OS (P≤0.05). Next, we took the features found significant in the uni- variate analysis as co-variates in the multivariate analysis to see how they jointly impact PFS and OS. In the analysis for PFS, only double-hit remained significant, but for OS, only high splicing remained close to significant (P=0.051, hazard ratio 6.62 [95%CI: 0.99-44.14]) (Online Supplementary Figure S7).
Discussion
In this study, we have investigated the impact of muta- tions in SF3B1 on the transcriptome, observing a signifi- cant impact of hotspot mutations of SF3B1 in codons K666/700 resulting in abnormal splicing patterns, as well as the introduction of novel transcripts. We were able to show that not all mutations in SF3B1 result in abnormal splicing, and that the key hotspots are the drivers of this aberrant phenomenon. We identified a number of alterna- tively spliced genes in common with other cancers with hotspot mutations in SF3B1, TMEM14C, RPL31, DYNLL1, UQCC, and CRNDE, indicating a commonality in biology between them. Comparison of all of our alter- natively spliced genes with those in uveal melanoma18 identified a similar number of alternatively spliced genes (935 vs. 1019), but only 165 (9%) genes overlapped. This low percentage overlap may indicate that hotspot muta-
742
haematologica | 2021; 106(3)
