
Page 222 - 2021_03-Haematologica-web
P. 222
868
Letters to the Editor
implants (Figure 2C, central panels). Moreover, immunostaining with dentin matrix acid phosphoprotein 1 (DMP1), a marker of mature osteocytes, revealed the presence of DMP1-negative osteocytes in AML-BMSC derived grafts, which differed from HD-BMSC trans- plants (Figure 2C, bottom panels).
In addition, histomorphometric analysis displayed a significantly reduced amount of bone tissue in AML- derived implants (bone area/tissue area [B.Ar/T.Ar] %; AML-derived vs. HD-derived implants: 3.33±1.11 vs. 10.24±1.28, P=0.002) (Figure 2A, right panel). Moreover, no changes were detected in the mineralized surface cov-
AC
BD
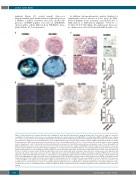
Figure 3. Altered in vivo bone marrow stromal niche formation by acute myeloid leukemia bone marrow stromal cells. (A) In order to study the capacity to recapitulate the hemopoietic niche in vivo, acute myeloid leukemia bone marrow stromal cells (AML-BMSC) or healthy donor BMSC (HD-BMSC) were cultured for 3 weeks as micro-masses in chondrogenic differentiation medium and then unmineralized pellets were transplanted subcutaneously into immunocompro- mised NSG mice. Eight weeks after transplantation, the bone/BM organoids were harvested. Representative images of AML- and HD-derived grafts are shown. Hematoxylin/eosin (H/E) stain (upper panel) revealed the presence, in both AML- and HD-ossicles, of a bony cortex with an inner marrow cavity containing murine hematopoietic cells. Undecalcified von Kossa/methylene blue stained sections (bottom panel) evidenced comparable levels of bone mineralization in AML- and HD-derived ossicles. Scale bars represent 200 mm. (B) Confocal fluorescence images confirming the human origin of the heterotopic ossicle. The human specific LaminA/C is detected in the nuclear membrane of osteocytes (arrows) and spread marrow cells (top panel). Bottom panel shows representative images of immunofluorescence staining for hCD146 of BMSC in association with vessels walls. Cell nuclei were stained with Topro-3 iodide. Scale bars represent 50 μm. (C) Details of marrow tissues in AML- and HD-derived ossicles are shown (H/E stain, left panel). Trabecular bone, hematopoiesis (he), adipocytes (ad) and sinusoids (sin) are observable (scale bars: 50 mm). Adipocytes were stained for perilipin (right top panel). Quantitative analysis of BM fraction occupied by adipocytes within bone/BM organoids (adipocyte area/marrow area [Ad.Ar/Ma.Ar], right low panel) demonstrated that in vivo adipogenic differentiation was increased in AML-BMSC. Columns shows the mean ± standard deviation (SD) of AML (n=5 grafts from three independent donors) and HD (n=5 grafts from two independent donor). (D) Quantification and characterization of hematopoietic tissue in the intertrabecular space within the ossicles. Evaluation of the presence of myeloid (MPO+) and erythroid cells (Ter-119+) within murine hematopoietic foci of AML- and HD-ossicles (left panel). Scale bars represent 100 mm. Quantification of total hematopoietic tissue in bone/BM organoids (right top panel). Quantification of myeloid/erythroid ratio in organoids (right low panel). Columns show the mean ± standard deviation of AML (n=4 grafts from three independent donors) and HD (n=2 grafts from two independent donor). bm: bone marrow.
haematologica | 2021; 106(3)
