
Page 221 - 2021_03-Haematologica-web
P. 221
Letters to the Editor
(previous page) Figure 1. In vitro characterization of bone marrow stromal cells derived from bone marrow of pediatric acute myeloid leukemia patients and healthy donors. (A) Phase-contrast images depicting spindle-shaped morphology of bone marrow stromal cells (BMSC) derived from pediatric acute myeloid leukemia (AML) patients and healthy donors (HD). Magnification 40x. (B) Colony forming unit (CFU-F) potential of AML- and HD-BMSC. Representative images of AML and HD CFU-F are shown in the left panel. Bar charts show mean ± standard deviation (SD) of CFU-F numbers normalized to 100 plated BMSC derived from AML (gray bar) vs. HD (white bar). (C) Proliferation measured as cumulative population doubling at each passage for AML-BMSC and HD-BMSC cultures. Bars show mean ± SD. (D) Expression of surface markers CD90, CD73, CD105, CD146, and HLA-DR on AML-BMSC and HD-BMSC at passage three. Bars rep- resent mean ± SD of mean fluorescence intensity (MFI) values. (E) Quantitative RT-PCR-based analysis of the baseline expression of hematopoietic niche regu- latory genes in AML-BMSC and HD-BMSC populations. KIT ligand (KITLG), vascular cell adhesion molecule 1 (VCAM1), angiopoietin 1 (ANGPT1), CXCL12, and Jagged1 (JAG1) expression was analyzed in BMSC derived from AML (n=8, independent donors) compared with HD (n=8 independent donors). Expression levels for each gene compared with the GAPDH housekeeping gene are shown as mean ± standard error of the mean (SEM). (F) Quantitative RT–PCR–based analysis of the baseline expression of transcription factors and lineage-specific genes associated with bone, cartilage, and adipose tissue formation in AML-BMSC and HD-BMSC populations. Osterix (SP7), runt-related transcription factor 2 (RUNX2), osteocalcin (BGLAP), osteopontin (SPP1), osteonectin (SPARC), type I collagen a2 chain (COL1A2), alkaline phosphatase (ALPL), aggrecan (ACAN), RUNX3, distal-less homeobox 6 (DLX6), SRY-box 9 (SOX9), fatty acid-binding protein 4 (FABP4), and peroxisome proliferator-activated receptor g (PPARG) expression was analyzed in at least four independent donors. Expression levels for each gene compared with the GAPDH housekeeping gene are shown as mean ± SEM. (G) Tri-lineage in vitro differentiation of AML-BMSC and HD-BMSC. BMSC were induced to differentiate along osteogenic, adipogenic, and chondrogenic lineage in vitro according to standard protocols. After 21 days of osteogenic induction, cells were stained with Alizarin Red for visualization of Ca2+ accumulation (left panel). Adipogenic differentiation capacity was visualized after 21 days of induc- tion by staining lipid droplets with Oil Red O (middle panel). The osteogenic and adipogenic differentiation was further verified by quantitative RT-PCR–based analysis for the expression of lineages markers (for osteogenesis: ALPL and SPP1; for adipogenesis: lipoprotein lipase (LPL), FABP4, and PPARG). GAPDH was used as reference housekeeping gene. Three-dimensional chondrogenic differentiation assay was used for evaluation of chondrogenic differentiation potential (right panel). After 21 days of induction, sections from cartilaginous pellets were stained with hematoxylin/eosin and Toluidine blue (top panels). Presence of chondrocytes within lacunae and of proteoglycans within cartilaginous matrix (Toluidine blue positive) reveal chondrogenic differentiation. Chondrogenesis was prolonged for an additional 2 weeks to obtain hypertrophic cartilage stained by methylene blue (bottom panels). Calcium deposition was stained in black using von Kossa. Scale bars represent 200 mm. For interindividual comparison the two-sided unpaired Students’ t-test was employed. Statistical significance was established at P≤0.05. *P≤0.05, **P≤0.01. und: undifferentiated; diff: differentiated; wks: weeks.
AC
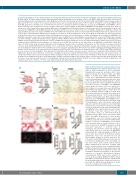
Figure 2. Altered in vivo osteogenic potential of acute myeloid leukemia bone marrow stromal cells. (A) In order to study osteogenesis in vivo a heterotopic transplantation assay was performed. 2x10⁶ acute myeloid leukemia bone marrow stromal cells (AML- BMSC) or healthy donor BMSC (HD-BMSC) were loaded onto a hydroxyapatite/tricalcium phosphate carrier and transplanted subcutaneously in the back of the immunocompromised SCID/beige mice. After 8 weeks, the grafts were harvested. Whole-mount Sirius red stained sections of HD-BMSC and AML-BMSC derived grafts (left panel). Scale bars represent 1 mm. Analysis of bone area/tissue area (B.Ar/T.Ar) by histomorphometry (right panel). Columns show the mean ± standard deviation of AML (n=7 grafts from three independent donors) and HD (n=6 grafts from two independent donors). **P≤0.01. (B) Histological analysis of hematoxylin/eosin (H/E) stained sections (top panel) of both AML-BMSC and HD-BMSC hetero- topic transplants revealed new bone formation along the hydroxyapatite carrier, and marrow cavities with adipocytes and host hematopoietic cells. Transmitted (central panel) and polarized- (bottom panel) light view of the same microscopic field stained with Sirius red highlighted the newly formed bone and its lamel- lar structure. Scale bars represent 100 mm. (C) Representative images of immunohistochemical staining for osterix (upper panel), osteocalcin (central panel), and DMP1 (bottom panel). Osterix positive osteoprogenitor cells and osteocytes (arrow and arrowhead, respectively) are detected in AML-derived samples. Conversely, in AML-BMSC derived grafts osteocalcin expression is closely restricted to osteo- cytes, as opposed to HD-BMSC transplants in which osteocalcin expression is detected either in osteoblasts and osteocytes (arrow and arrowhead, respectively). Moreover, osteocytes in AML-BMSC derived grafts are completely negative for DMP1, con- trary to what was observed in HD-derived samples (arrowhead). Scale bars represent 50 mm. (D) Representative images of sections stained for the osteoclastic marker TRAP (left panel). Scale bars rep- resent 50 mm. Quantification of the mineralized sur- face (bone surface plus scaffold surface) lined by TRAP+ multinucleated osteoclasts (OcS/MS, right panel). Columns show the mean ± standard deviation of AML (n=6 grafts from two independent donors) and HD (n=4 grafts from two independent donors). (E) Quantitative RT-PCR–based analysis of the baseline expression of osteoclasts differentiation regulators osteoprotegerin (OPG) and receptor activator of nuclear factor-κ B ligand (RANKL) in BMSC derived from AML (n=8 independent donors) compared with HD (n=8 independent donors). Expression levels com- pared with the GAPDH housekeeping gene is shown as mean ± standard error of the mean.
BD
E
haematologica | 2021; 106(3)
867
