
Page 163 - 2021_03-Haematologica-web
P. 163
Hepcidin and Trypanosoma brucei infection
AB
CD
E
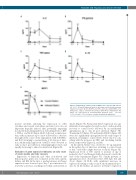
Figure 2. Inflammatory cytokine profile in BALB/c mice infected with T.b. bru- cei. 1, 4, 7, 14 and 21 days post infection, blood was collected and serum was obtained to measure (A) IL-6, (B) IFN-g, (C) TNF-a, (D) IL-10, and (E) MCP1 circu- lating levels, using a Cytometric Bead Array (CBA) Mouse Inflammation Kit. Values are represented as mean±standard deviation (n=5). *P<0.05, **P<0.01, and ***P<0.001 were considered statistically significant.
matory cytokine, inducing the expression of other cytokines and several acute phase proteins, but is also an important hepcidin inducer, thus potentially impacting iron metabolism during infection. Circulating levels of IFN- g, TNF-a and IL-10 (Figure 2B-D) followed a similar pat- tern, with an increase up to day 4 followed by a decrease throughout the course of the experiment, with both IFN-g and IL-10 returning to normal levels at 21 days post infec- tion. Additionally, high levels of MCP-1 were observed as early as day 1 post infection, remaining high at day 4, and rapidly decreasing to almost normal levels (Figure 2E).
Evaluation of gene expression indicates an early onset of acute anemia and later recovery
Expression of hepcidin and other iron-related and hematopoietic genes was evaluated in the liver, spleen, kidney and BM. In the liver, a gradual increase in Hamp1 expression was observed up to day 7 post infection, fol- lowed by a decrease, reaching lower than control levels at
day 21 (Figure 3A). Ferroportin (Fpn1) expression was sig- nificantly down-regulated as early as day 1, with a gradual recovery to control levels followed by an incremental upregulation up to day 21 post infection (Figure 3B). Transferrin (Tf) (Figure 3C) and ferritin H (Fth1) (Figure 3D) were also significantly up-regulated at the early stages of infection, returning to control levels before day 14, coin- ciding with the increases in TIBC and circulating ferritin levels, respectively (Figure 1L and M).
In the spleen, Hamp1 was observed to be up-regulated in the earlier days of infection, returning to control levels at day 7 and with a slight decrease at day 21 (Figure 3E). Expression levels of Fth1 started to increase at day 4, peaked at day 7, and then gradually decreased towards the end of the experiment (Figure 3G). Similar patterns of upregulation were observed for Fpn1, Hbb, Epor, Erfe and Twsg1 (Figure 3F, H-K), with significant increases in expression starting as early as day 4, and maintained up to day 21. In the kidney, an increase in Hamp1 expression
haematologica | 2021; 106(3)
809
