
Page 156 - 2021_03-Haematologica-web
P. 156
A. Nai et al.
inactivation would worsen the erythroid phenotype of Hbbth3/+ animals if NCOA4 was playing an important role in hemoglobinization of erythroid precursors, as suggest- ed.5 To investigate this, we bred Ncoa4-ko mice with Hbbth3/+ animals and evaluated the CBC at 1, 2 and 4 months of age in double mutants. Ncoa4 haploinsufficien- cy had no effect on anemia of Hbbth3/+ mice at any time point (Figure 6). Deletion of both Ncoa4 alleles induced a
A
B
modest, statistically significant increase of RBC count at 2 and 4 month of age (Figure 6A), which may result from the iron-restricted phenotype caused by reduced iron recycling, as suggested by further decreased MCV (Figure 6C) and MCH (Figure 6D) of double-mutant mice com- pared to Hbbth3/+ controls.
In conclusion Ncoa4 deletion did not aggravate anemia in this model, suggesting a minor, if any, effect of NCOA4
CD
EF
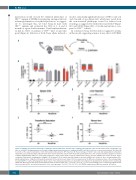
Figure 5. Erythropoiesis and iron phenotype of wild-type and Ncoa4-ko mice after an acute erythropoietin challenge. Three-month old Ncoa4-ko and wild-type (wt) mice on a Sv129/J background were treated with a single intraperitoneal injection of erythropoietin (EPO; 8 IU/g) or saline as a control and sacrificed 15 h later. (A) A scheme of the expected alterations of iron homeostasis induced by the EPO injection. (B) The percentage of Ter119+ alive cells and subpopulation composition (determined as described in Figure 1B) both in the bone marrow and in the spleen of EPO-treated wt and Ncoa4-ko mice. The complete statistical analysis is reported in Online Supplementary Table S7. (C) Real-time polymerase chain reaction (PCR) of splenic erythroferrone (Erfe) to measure mRNA levels relative to those of glyc- eraldehyde 3-phosphate dehydrogenase (Gapdh). (D) Real-time PCR of hepatic hepcidin (Hamp) to measure mRNA levels relative to those of hypoxanthine phos- phoribosyltransferase 1 (Hprt1). (E) Transferrin saturation. (F) Serum Iron levels. Data in (C-F) are expressed as the difference (Δ) between mice of the same genotype treated with EPO or saline (dotted gray line). Mean values of five animals per genotype are shown. Error bars indicate the standard error. Asterisks refer to statistically significant differences between age-matched EPO-treated wt and Ncoa4-ko mice. *P<0.05; **P<0.01; ***P<0.005. Hashtags refer to statistically significant dif- ferences between EPO- and saline-treated mice of the same genotype. #P<0.05; ##P<0.01; ###P<0.005. ERFE: erythroferrone; BM: bone marrow; SP: spleen.
802
haematologica | 2021; 106(3)
