
Page 86 - 2021_02-Haematologica-web
P. 86
R. Agoro et al.
ABC
DEF
GH
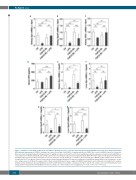
Figure 7. Inhibition of fibroblast growth factor 23 (FGF23) signaling increases renal and extra-renal EPO and EpoR mRNA expression under lipopolysaccharide (LPS)-induced hypoferremia. C57BL/6J wild-type mice were treated with C-tail FGF23 (1 mg/kg, indicated as FGF23 BL) or vehicle (HEPES buffer) for 8 hours (h). Mice were then challenged with LPS (intraperitoneal 50 mg/kg) or vehicle (0.9% NaCl) for 4 h. (A-C) Quantitative real-time polymerase chain reaction (qRT-PCR) for renal expression of (A) Epo, (B) EpoR, and (C) Hif2α. (D) Serum concentration of Epo measured by ELISA. (E-H) qRT-PCR for Epo expression in (E) spleen and (F) liver, and EpoR expression in (G) spleen and (H) liver. Data are expressed as fold change (2-DDCt) relative to housekeeping genes Gapdh or Hprt. Samples were measured in duplicates (n=5-7 per group). Data are represented as mean+standard deviation. All data were analyzed for normality by Shapiro-Wilk test and equivalence of vari- ance using Levene’s test. When the samples did not show normal distribution, they were aligned in RANK transformation, and confirmed for normality. As the samples showed normal distribution, two-way ANOVA was performed with Bonferroni’s multiple comparison test (B, F, and H). The samples not in normal distribution were analyzed with non-parametric Kruskal-Wallis test (A, C-E, and G). Ctl: control (vehicle), ns: not significant, *P<0.05, **P<0.01, ***P<0.001.
400
haematologica | 2021; 106(2)
