
Page 80 - 2021_02-Haematologica-web
P. 80
R. Agoro et al.
AB
CD
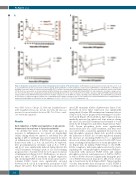
Figure 2. Regulation of phosphate homeostasis following lipopolysaccharide (LPS) administration. (A) Phosphate levels measured in serum and urine at 0, 1, 2, 4, 6, 12, and 24 hours (h) after i.p. injection of LPS (50 mg/kg). (B-D) Quantitative real-time polymerase chain reaction (qRT-PCR) for renal (B) Klotho, (C) NaPi2a, and (D) NaPi2c expression. Data are expressed as fold change (2-DDCt) relative to housekeeping gene Gapdh. Samples were measured in duplicates (vehicle, n=3-4; LPS, n=5-8). Data are represented as mean+standard deviation. All data were analyzed for normality with Shapiro-Wilk test and equivalence of variance using Levene’s test. For serum Pi, data were analyzed by non-parametric Kruskal-Wallis test; for the ratio of urinary Pi to creatinine, data were aligned in RANK transformation and analyzed with one-way ANOVA followed by Bonferroni’s multiple comparison test (A). With the samples showing normal distribution, two-way ANOVA was performed in each vehicle- or LPS-treated group compared to 0 h with Bonferroni’s multiple comparison test (C). The samples not in normal distribution were analyzed with non- parametric Kruskal-Wallis test (B and D). ns: not significant, *P<0.05, **P<0.01, ***P<0.001 compared to 0 h.
ware (SPSS Sciences, Chicago, IL, USA) and GraphPad Prism 8 (2019 GraphPad Software, Inc. La Jolla, CA, USA). All values are presented as mean+standard deviation (SD). P<0.05 was consid- ered statistically significant.
Results
Early induction of Fgf23 and regulation of phosphate homeostasis in response to lipopolysaccharide
To identify the series of events that take place in response to inflammation, we carried out longitudinal studies during which we injected a sub-lethal dose (50 mg/kg) of LPS to wild-type mice and evaluated its effect on inflammatory markers, FGF23 levels, and phosphate homeostasis after 1, 2, 4, 6, 12, and 24 h. As expected, liver pro-inflammatory cytokines such as IL-6, TNF-α, and IL-1β were significantly induced during the first 6 h of LPS treatment, reaching a peak at 1 h, and returning progressively to baseline levels by 12 h upon resolution of inflammation (Figure 1A-C). Furthermore, we investi- gated the effect of LPS treatment on Fgf23 expression and circulating FGF23 levels. Both serum intact and C- terminal FGF23 levels were significantly elevated between 2-6 h or 2-12 h, respectively, in response to LPS (Figure 1D and E). Bone Fgf23 expression increased 4 h
after LPS treatment (Online Supplementary Figure S1A). However, in liver, Fgf23 expression was significantly upregulated 2 h after LPS treatment and remained elevat- ed up to 12 h, before progressively returning to basal lev- els by 24 h (Figure 1F). In addition, Fgf23 expression was markedly increased in spleen and bone marrow during the first 12 h after LPS treatment and returned to basal levels by 24 h (Figure 1G and Online Supplementary Figure S1B). Serum phosphate levels were significantly increased the first 2 h of LPS treatment, and they were associated with a concurrent significant decrease in uri- nary phosphate excretion (Figure 2A), possibly causing the induction of FGF23. In a counter-regulatory manner, the increase in circulating FGF23 led to a significant increase in urinary phosphate levels 6 h after LPS treat- ment, resulting in normalization of serum phosphate lev- els (Figure 2A). In kidney, FGF23 binds to the FGFR- Klotho complex to induce phosphate excretion by down- regulating the sodium-phosphate transporters NaPi2a/c. Consistent with increased FGF23 levels and urinary phosphate excretion, renal expression of NaPi2a, NaPi2c, as well as Klotho, decreased significantly during the peri- od of FGF23 elevation in response to LPS, before return- ing to basal levels by 24 h (Figure 2B-D). Taken together, our data demonstrate that, in response to LPS, FGF23 is induced as early as inflammatory markers, resulting in
394
haematologica | 2021; 106(2)
