
Page 79 - 2021_02-Haematologica-web
P. 79
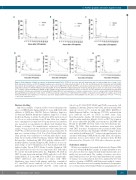
C-FGF23 peptide alleviates hypoferremia
ABC
DEFG
Figure 1. Early induction of Fgr23 in response to lipopolysaccharide (LPS). C57BL/6J mice were injected intraperitoneally (i.p.) with a single dose of saline (0.9% NaCl, indicated as Vehicle) or LPS (50 mg/kg). Samples were collected at 0 (saline injection only), 1, 2, 4, 6, 12, and 24 hours (h) after treatment and total mRNA was isolated. (A-C) Quantitative real-time polymerase chain reaction (qRT-PCR) of (A) IL-6, (B) TNF-α, and (C) IL-1β expression in liver. (D and E) Serum concentration of (D) intact and (E) C-terminal FGF23 measured by ELISA. (F and G) qRT-PCR for Fgf23 expression in (F) liver and (G) spleen. Data are expressed as fold change (2-DDCt) relative to housekeeping genes Gapdh or Hprt. Samples were measured in duplicates (vehicle, n=3-4; LPS, n=5-8), and data are represented as mean+stan- dard deviation. All data were analyzed for normality with Shapiro-Wilk test and equivalence of variance using Levene’s test. For samples with normal distribution, two-way ANOVA was performed in each vehicle- or LPS-treated group compared to 0 h with Bonferroni’s multiple comparison test (D). When the samples were not in normal distribution and equivalence of variance, data were analyzed with non-parametric Kruskal-Wallis test (A-C, E-G). ns: not significant, *P<0.05, **P<0.01, ***P<0.001 compared to 0 h.
Western blotting
Snap frozen samples of spleen and liver were homogenized in an ice-cold RIPA buffer (Sigma-Aldrich, St. Louis, MO, USA) with addition of EDTA-free HaltTM Protease Inhibitor Single-use Cocktail and HaltTM Phosphatase Inhibitor Single-Use Cocktail (both from Thermo Scientific, Rockford, lL, USA) and were lysed for 2 h on ice with vortexing every 15 min. After lysis, samples were centrifuged for 20 min at 13,000 g and protein concentration was measured in supernatants by Quick Start Bradford Dye Reagent according to the manufacturer’s instructions. For each sample, 30 mg of protein was loaded into 4-20% Mini-Protean® TGXTM Precast Protein Gels. Electrophoresis was performed for 18 min on a constant voltage of 300 V in a Tris/Glycine/SDS buffer. Then proteins were transferred to 0.45 mm nitrocellulose mem- brane by wet method with Tris/Glycine Transfer buffer (Quality Biological Inc., Gaithersburg, MD, USA) with the addition of 20% methanol (Fisher Scientific, Hampton, NH, USA) for 1 h on a con- stant voltage of 110 V. Membranes were then washed with Tris- buffered saline Tween (TBST) (Fisher Scientific, Hampton, NH, USA) and blocked for 2 h at room temperature (RT) with either 5% non-fat dry milk (LabScientific Inc., Highlands, NJ, USA) in TBST (for anti-ferroportin and anti-STAT3 antibodies) or 5% BSA (Sigma-Aldrich, St. Louis, MO, USA) in TBST (for anti-phospho- STAT3 antibodies) and washed four times with TBST. Membranes were stained with primary antibodies overnight at 4°C: anti-STAT3 mouse antibody (1:1,000 on 5% non-fat dry milk-TBST), anti-phospho-STAT3 (Tyr705) rabbit antibody
(1:2,000 on 5% BSA-TBST) (#9139 and #9145, respectively, Cell Signaling Technology, Danvers, MA, USA), anti-ferroportin rabbit antibody (1:1,000 on 5% non-fat dry milk TBST) (#MTP11-S, Alpha Diagnostic Intl Inc., San Antonio, TX, USA), and anti-Actin goat antibody (1:1,000 on TBST) (sc-1616, Santa Cruz Biotechnology Inc., Dallas, TX, USA). Membranes were stained with secondary antibodies diluted 1:10,000 on TBST for 30 min at RT: mouse-anti-rabbit IgG-HRP, goat-anti-mouse IgG-HRP and Rb-anti-Gt IgG-HRP (all from Santa Cruz Biotechnology Inc., Dallas, TX, USA). After incubation, membranes were washed with TBST four times. Visualization was performed with Clarity Western ECL Substrate and ChemiDocTM XRS+ imager, images were analyzed with Image LabTM, and protein signal intensity was calculated with ImageJ (NIH, Bethesda, MD, USA). All reagents, materials, devices and software were purchased from Bio-Rad Laboratories Inc., Hercules, CA, USA, unless otherwise specified.
Statistical analysis
All data were analyzed for normal distribution by Shapiro-Wilk tests and “Normal Q-Q Plot” graphs. If normal distribution was not achieved, data were aligned in rank transformation and a nor- mality test was performed. The equality of variance was deter- mined with Levene’s test. If both normal distribution and equality of variance were demonstrated, data were analyzed by two-way analysis of variance (ANOVA) with Bonferroni’s multiple compar- ison test. When data were not normally distributed, non-paramet- ric test was performed by Kruskal-Wallis test using SigmaStat soft-
haematologica | 2021; 106(2)
393
