
Page 330 - 2021_02-Haematologica-web
P. 330
Case Reports
A
B
C
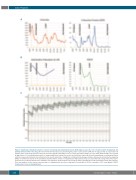
Figure 2. Significant inflammatory markers from the hemophagocytic lymphohistiocytosis (HLH) diagnosis up to the end of treatment with emapalumab and pharmacokinetics (PK) of the drug. (A) Serum ferritin (normal values [nv]: 15-150 ng/mL) and C-reactive protein (CRP) (nv <6 mg/L); trends are reported in red and blue lines, respectively. (B) IL2 receptor (nv 600-2000 pg/mL) and CXCL9 levels are reported in purple and green, respectively. Normal ranges are reported in light yellow. (C) Concentration-time profile of emapalumab in the patient. Green dots and solid lines represent observed emapalumab concentrations. Black solid lines represent simulated concentrations for the specific patient (i.e., taking into consideration the dosage schedule and measured total interferon gamma (IFNγ) concentrations) based on the population pharmacokinetic model of emapalumab in HLH patients. Gray area surrounded by orange dotted lines repre- sents the 90% prediction interval of the simulated concentrations. Dotted red line represents the limit of quantification of the bioanalytical assay (62.5 ng/mL). Ticks and numbers on the top line represent times of administration and dose in mg/kg. IL2: interleukin 2; CXCL9: chemokine (C-X-C motif) ligand 9; HSCT: hematopoietic stem cell transplantation.
644
haematologica | 2021; 106(2)
