
Page 323 - 2021_02-Haematologica-web
P. 323
Letters to the Editor
AB
C
D
E
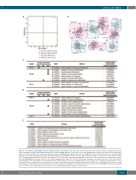
Figure 2. P-erymk41(+) with GATA1 mutation display activation of pathways that cause abnormal myelopoiesis. (A) Principal component analysis (PCA) map- ping P-erymk41(+) (CD34+CD43+CD235-CD11b-CD71+CD41+)of GATA1-wild-type clones (WT-clones) and GATA1-mutated clones (G1s-clones) from Ts21-embry- onic stem cells (Ts21-ESC) and transient abnormal myelopoiesis (TAM)-induced pluripotent stem cell (TAM-iPSC) strains. (B-F) The results of a clustering algo- rithm for automated functional annotations. (B) An expanded map showing the clusters of genes extracted by the positive correlation (correlation index >0.8 in the PCA shown in (A)) with WT (blue) and G1s (-) (magenta). The closed circles depict genes originally included in the PCR array. Open circles depict genes replen- ished by GENEMANIA. Each gene is listed in the Online Supplementary Table S4. (C-E) The intracellular pathways specifically enriched in (C) WT and (D) G1s cell populations. GO terms with P<0.08 in Bonferroni step down analysis are listed. No significant GO terms for gene sets categorized to WT cluster D or G1s clusters D or E were enriched. The closed circles in (C) and (D) show the lineage specifications indicated by GO terms. The open triangle in (C) depicts the indi- cated negative relationship to myeloid differentiation. (E) The intracellular pathways specifically enriched in the G1s-clones P-erymk41(+) filtered by “biological process”. The top 10 GO terms based on P-values corrected with Bonferroni step down <0.001 are listed.
haematologica | 2021; 106(2)
637
