
Page 322 - 2021_02-Haematologica-web
P. 322
636
Letters to the Editor
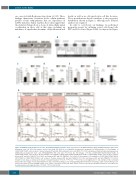
ues corrected with Bonferroni step down <0.001). These findings characterize deviations in the cellular pathway profiles of this subpopulation that are dependent on GATA1 mutation. Taken together, these data suggest that the mutation brings about a decay of intracellular signal coordination in these cells at this stage, including an imbalance of signals that determine cell proliferation and
death, as well as in cells involved in cell fate decision. Those perturbations should contribute to the progenitor distribution shown in Figure 1, although more detailed analyses are required.
In order to corroborate our findings, we performed progenitor assays by culturing sorted cells from both WT- and G1s-clones (Figure 3A-B). As depicted in Figure
AB
CDEF
G
Figure 1. GATA1-dependent differences in the CD34+CD43+CD235- progenitor stage. (A) Schema of the GATA1-wild-type (WT) and GATA1-mutated (G1s) Ts21- pluripotent stem cell (PSC) line panels used in this study. (B) Protocol for sequential hematopoietic progenitor cell differentiation. (C) Percentages of CD34+CD43+CD235- cells on day 9. P-values between WT and G1s Ts21-embryonic stem cells (ESC): P=0.0079; and between transient abnormal myelopoiesis (TAM)-induced pluripotent stem cells (iPSC)(TAM-iPSC) WT and G1s: P<0.0001. (D) Percentages of P-mye (CD34+CD43+CD235-CD11b+CD41-) in CD34+CD43+CD235- cells on day 9. (E) Percentages of P-erymk41(-) (CD34+CD43+CD235-CD11b-CD71+CD41-) in CD34+CD43+CD235- cells on day 9. P-values between WT and G1s Ts21-ESC: P=0.0303; and between WT and G1s TAM-iPSC: P=0.0134. (F) Percentages of P-erymk41(+) (CD34+CD43+CD235-CD11b- CD71+CD41+) in CD34+CD43+CD235- cells on day 9. P-values between WT and G1s Ts21-ESC: P=0.016; and between WT and G1s TAM-iPSC: P=0.0199. Student’s t-test. Data are shown as the mean + standard deviation. *P<0.05, **P<0.01, ***P<0.001; n.s: not significant; n = 3-4. (G) Table of the correlation between the percentage of each subpopulation on day 9 (column headings, y-axis) and logarithmically-transformed cell number of the resultant lineage-com- mitted cells on day 16 (row headings, x-axis) of the culture. Correlation coefficients and P-values (Pearson correlation in GraphPad Prism) for each square are described under each regression line. *P<0.05, **P<0.01; n=10-14.
haematologica | 2021; 106(2)
