
Page 276 - 2021_02-Haematologica-web
P. 276
590
Letters to the Editor
mumab. We further showed that knockdown of CD38 inhibited mitochondrial content in AML when cultured with MSC (Figure 1E and F).
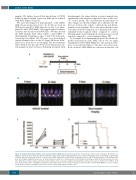
We next investigated if daratumumab could inhibit AML disease progression in vivo. To do this we used an NSG mouse model of AML whereby on day 1 we trans- planted 0.5x10⁶ OCI-AML3 cells tagged with a luciferase construct into the tail vein of NSG mice.3 We then treated the NSG animals with either vehicle control (PBS) or daratumumab (5 mg/kg) on days 9 and 16 by intra-peri- toneal injection (Figure 2A). The mice were then imaged using bioluminescence on day 21. Figure 2B shows biolu- minescence from live in vivo imaging. The pre-treatment tumor burden was the same between treatment and con- trol animals on day 9; however, following treatment with
daratumumab, the tumor burden in treated animals was significantly reduced when compared to mice in the vehi- cle control group. The densitometry measurement of these images are shown in Figure 2C to illustrate the dif- ferences between the vehicle control group and daratu- mumab-treated animals. These data show that there was less tumor-derived bioluminescence intensity in the dara- tumumab-treated animals when compared to control. Daratumumab-treated animals also had increased overall survival compared to control animals (Figure 2D).
To determine how daratumumab altered the metabolic profile and function of the AML cells in vivo, we again transplanted 0.5x10⁶ OCI-AML3-luc cells and treated the mice as described in Figure 2. The mice were then sacri- ficed on day 21. OCI-AML3-luc cells were isolated by cell
B
A
CD
Figure 2. Daratumumab (Dara) inhibits acute myeloid leukemia (AML) disease progression in vivo. (A) Schematic of the in vivo model used. (B) 0.5x10⁶ OCI- AML3-luc cells were injected into the tail vein of NSG mice. Mice were imaged using bioluminescence at day 9 following injection to confirm tumor engraftment, and then split into two groups. Group 1 received vehicle (PBS) and group 2 received Dara (5 mg/kg) on days 9 and 16 by intra-peritoneal (IP) injection. Mice were then imaged using bioluminescence at day 21 and then sacrificed. (C) Densitometry of the bioluminescent images shown in (B) was performed to deter- mine differences between vehicle and Dara-treated animals. (D) In a separate experiment, Kaplan-Meier survival curves were performed for C57BL/6 (n=5) mice injected with 0.5x10⁶ OCI-AML3-luc and then treated with vehicle or Dara at days 9 and 16 post injection. We used the Mann-Whitney U test to compare results between groups. The Mantel-Cox test was used to analyze Kaplan-Meier survival curves.
haematologica | 2021; 106(2)
